TL;DR
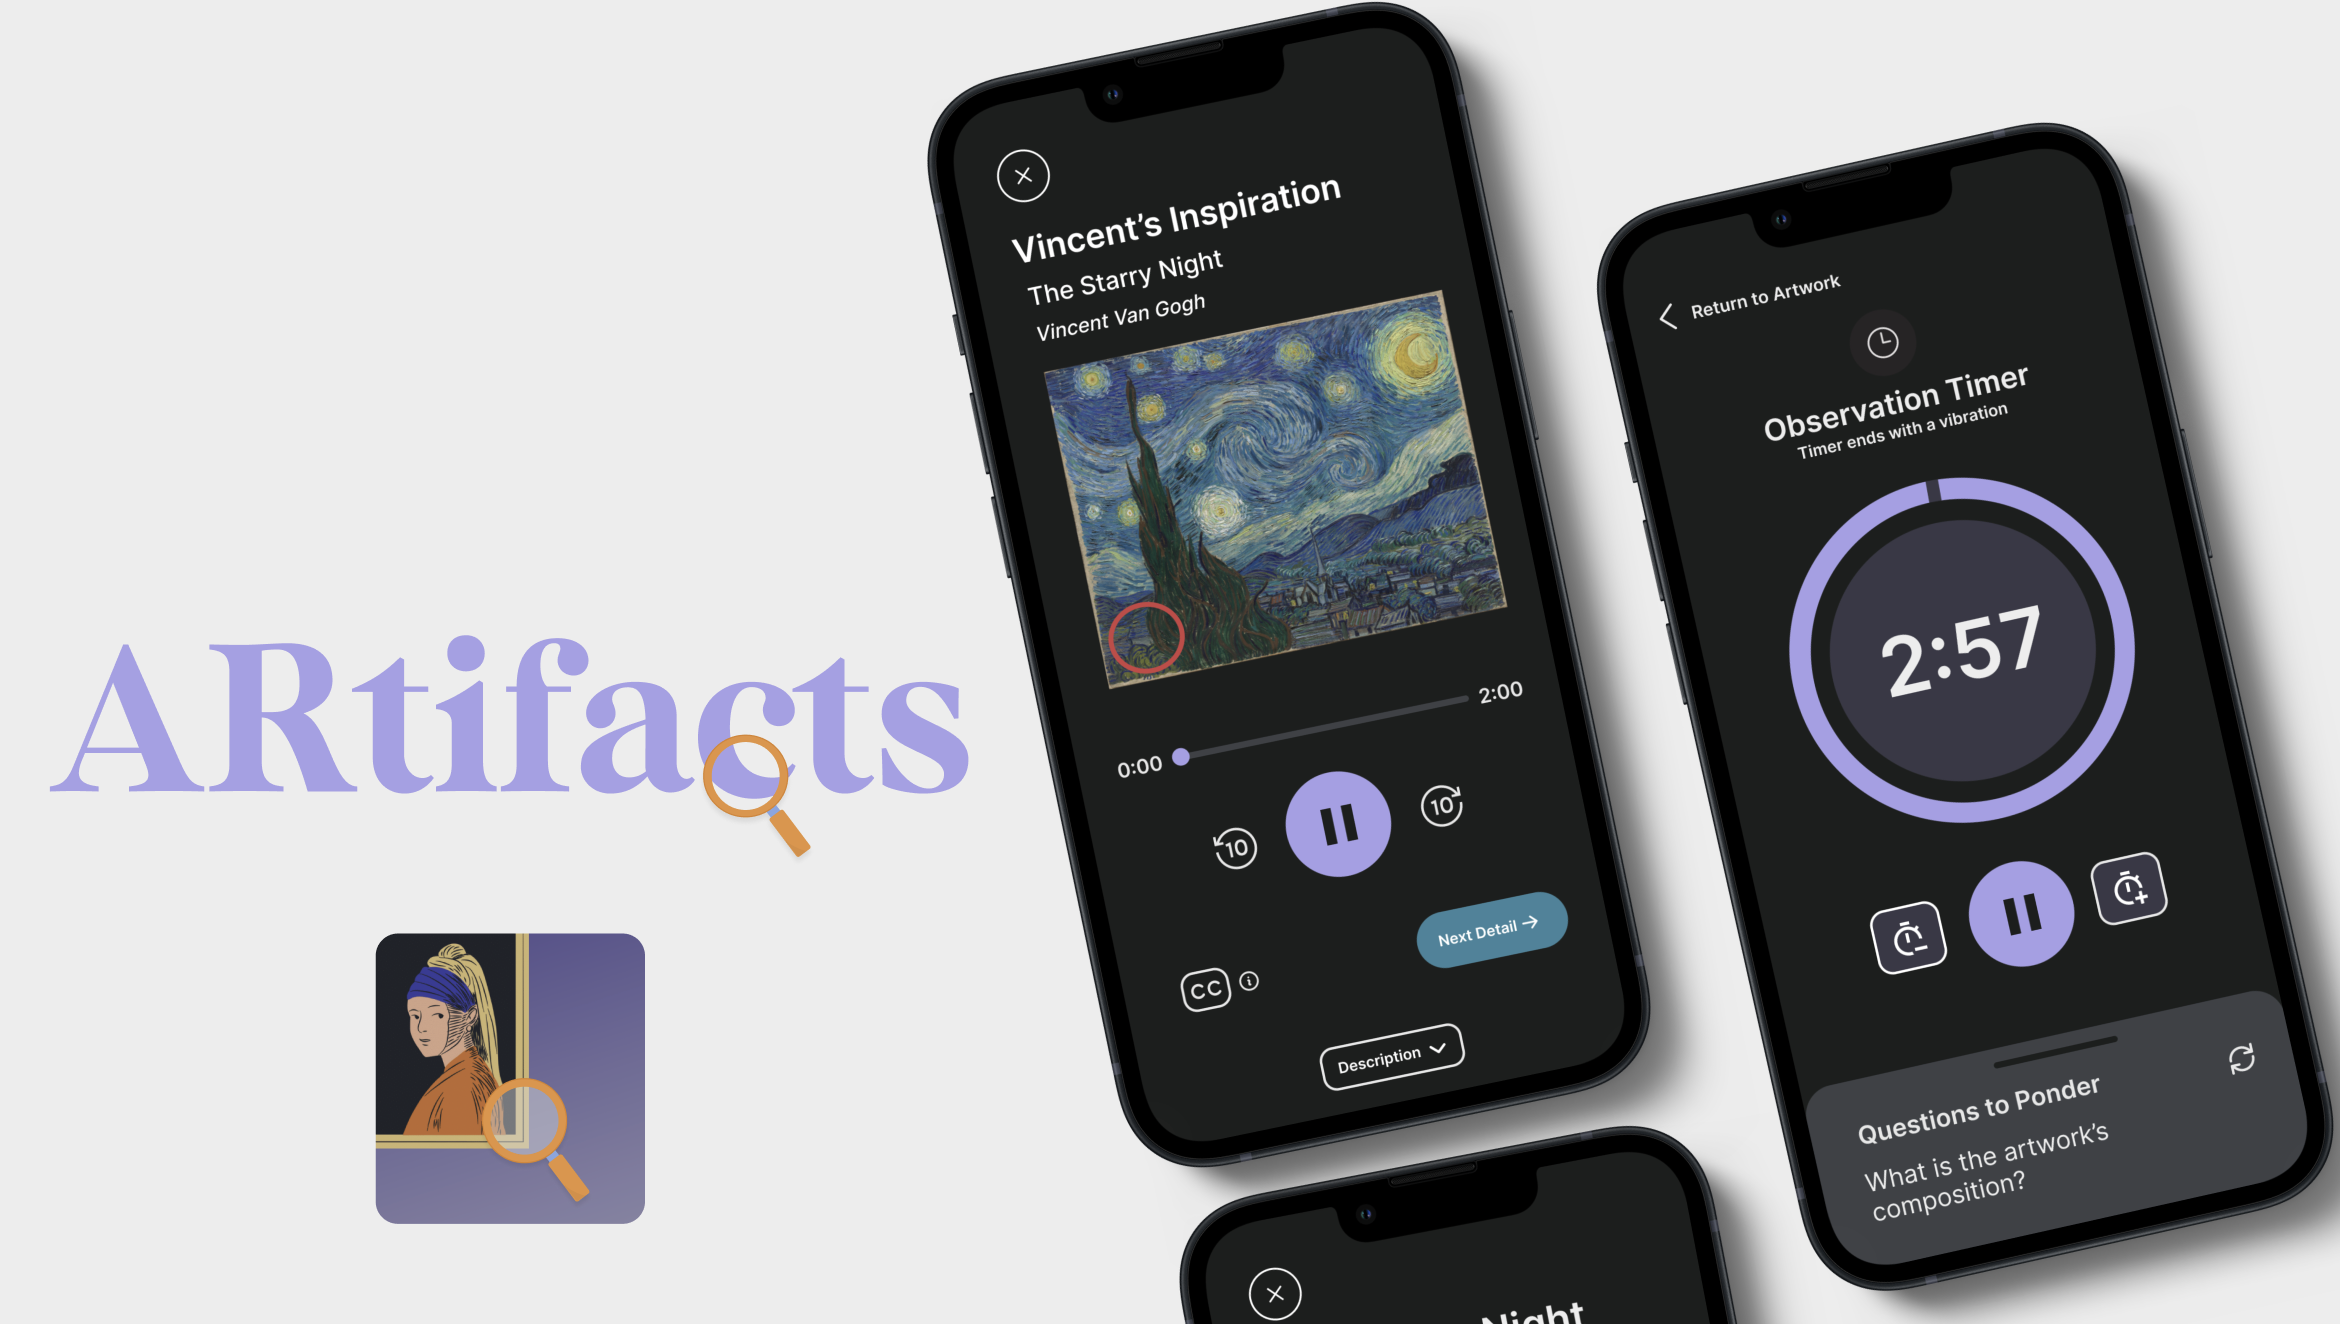
In 2022, New York City art museum attendance had not recovered since the pandemic. Using qualitative and quantitative research, I designed ARtifacts, a mobile app that lets people scan artwork at any NYC museum to learn more and unlock exclusive images and AR experiences.
Problem
Problem
Art museums preserve history and make it accessible to the public, but fewer people are visiting.
Key challenges
Attendance has not recovered
A 2022 study from the American Alliance of Museums found attendance has plateaued, and for some, declined since pandemic lockdowns ended. The Met’s May 2022 attendance was 316,000, about 62 percent of May 2019.
A lot is at stake
Museums help the local economy and promote research, creativity and education for all, so increasing visitor attendance is imperative.
Solution
Solution
ARtifacts is a NYC art museum companion app that makes the visit more engaging through location-based features.
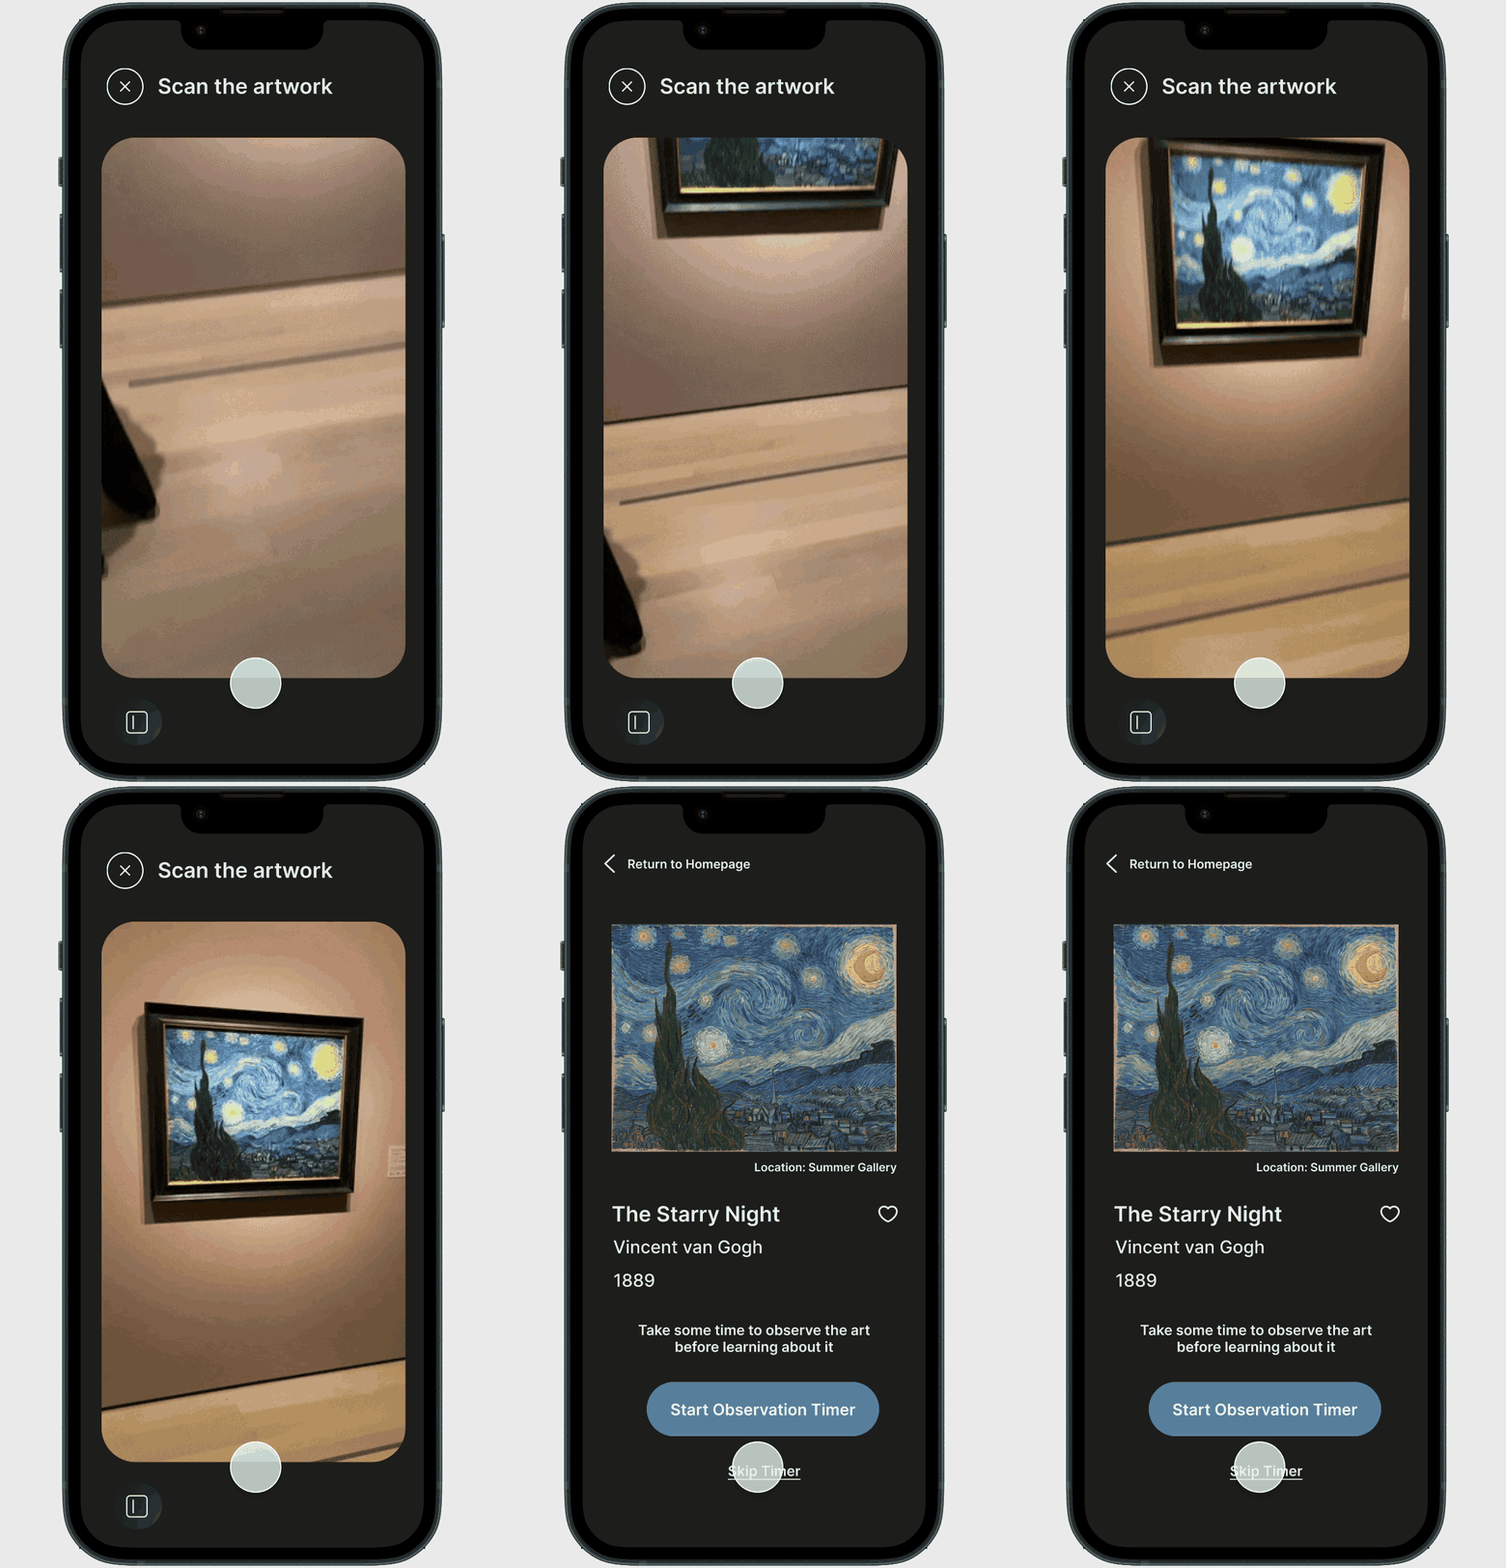
Scan artwork
Scan the artwork or enter its number to go beyond what is on the plaque.
Observation timer
A timer suggests the ideal time to look at an artwork before the next experience unlocks.
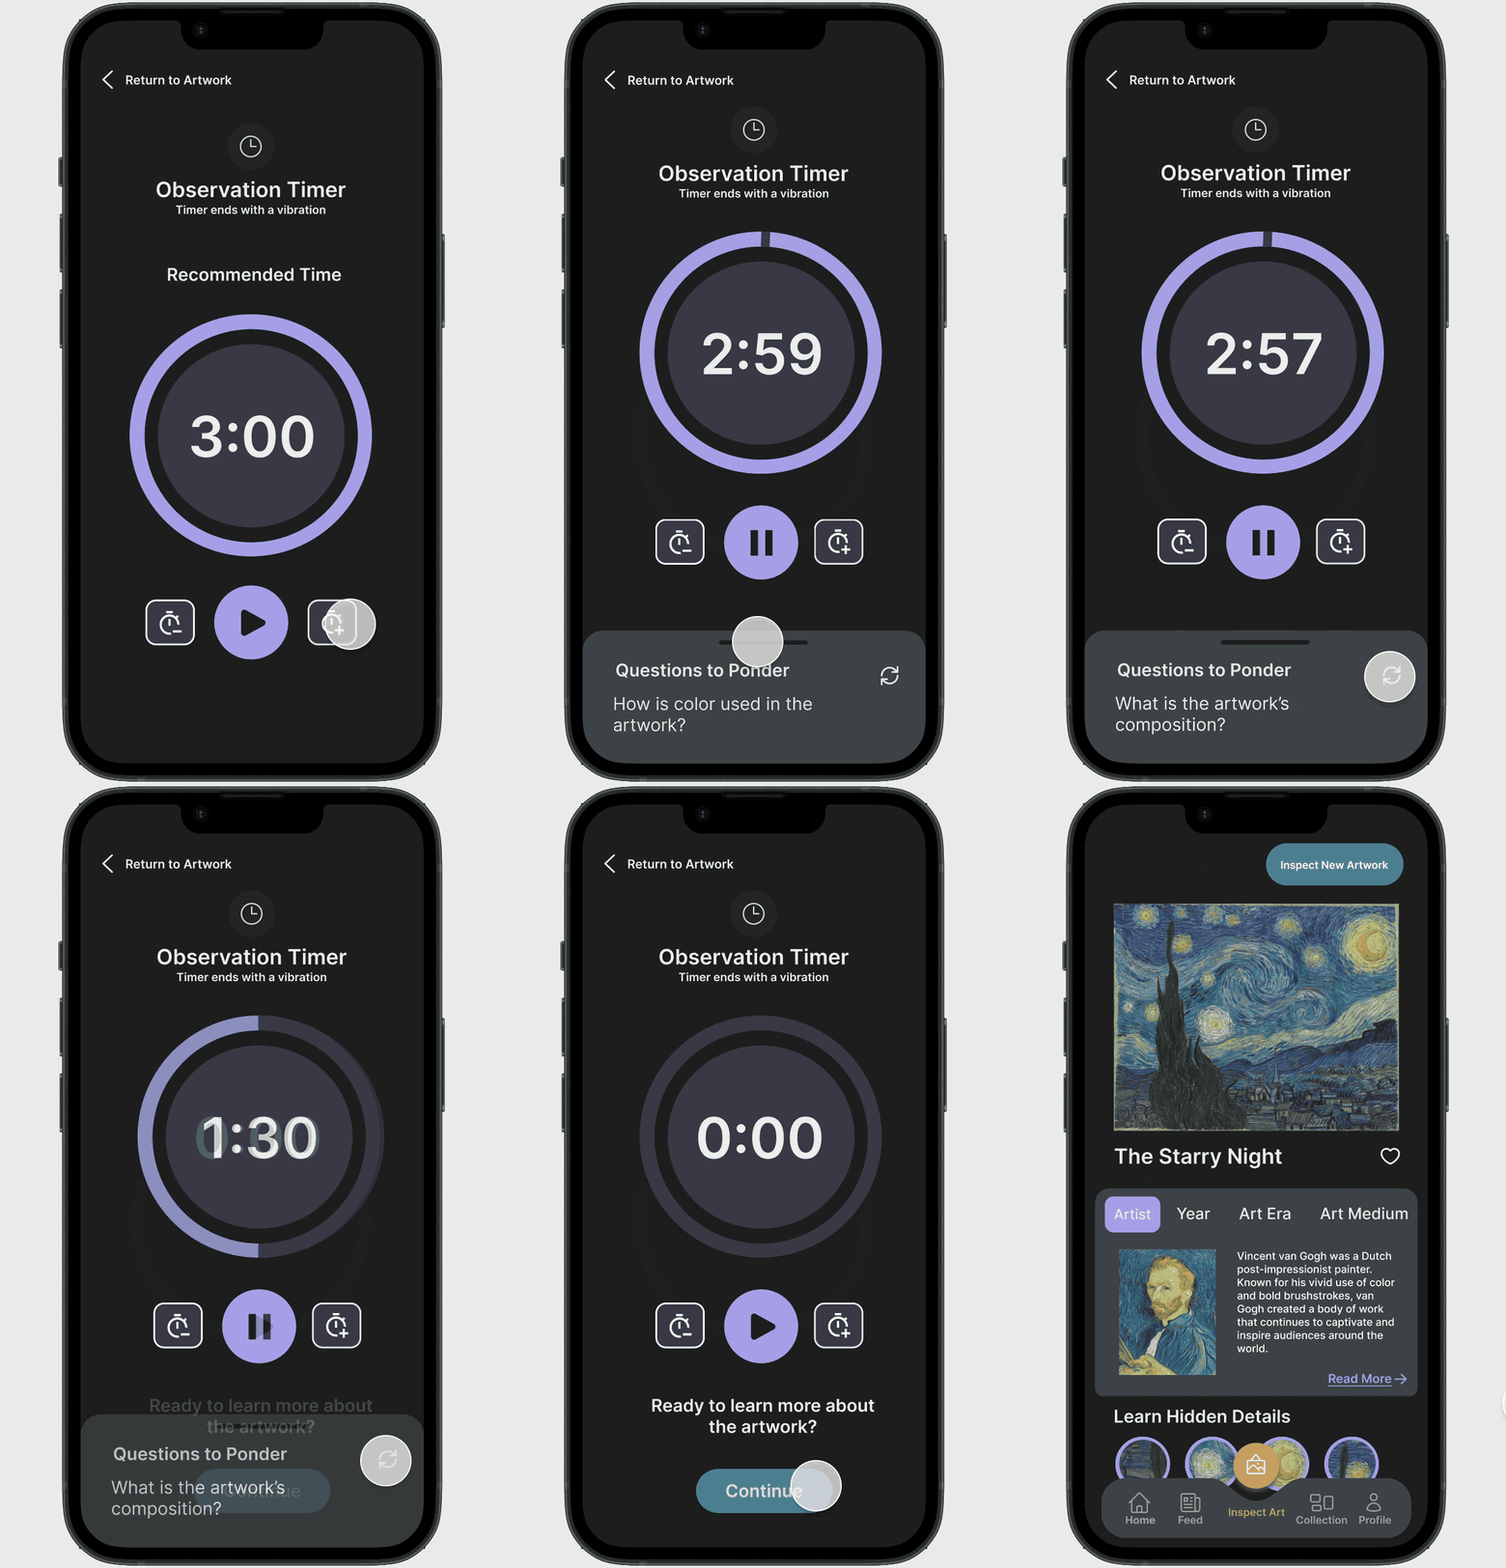
Dive deeper
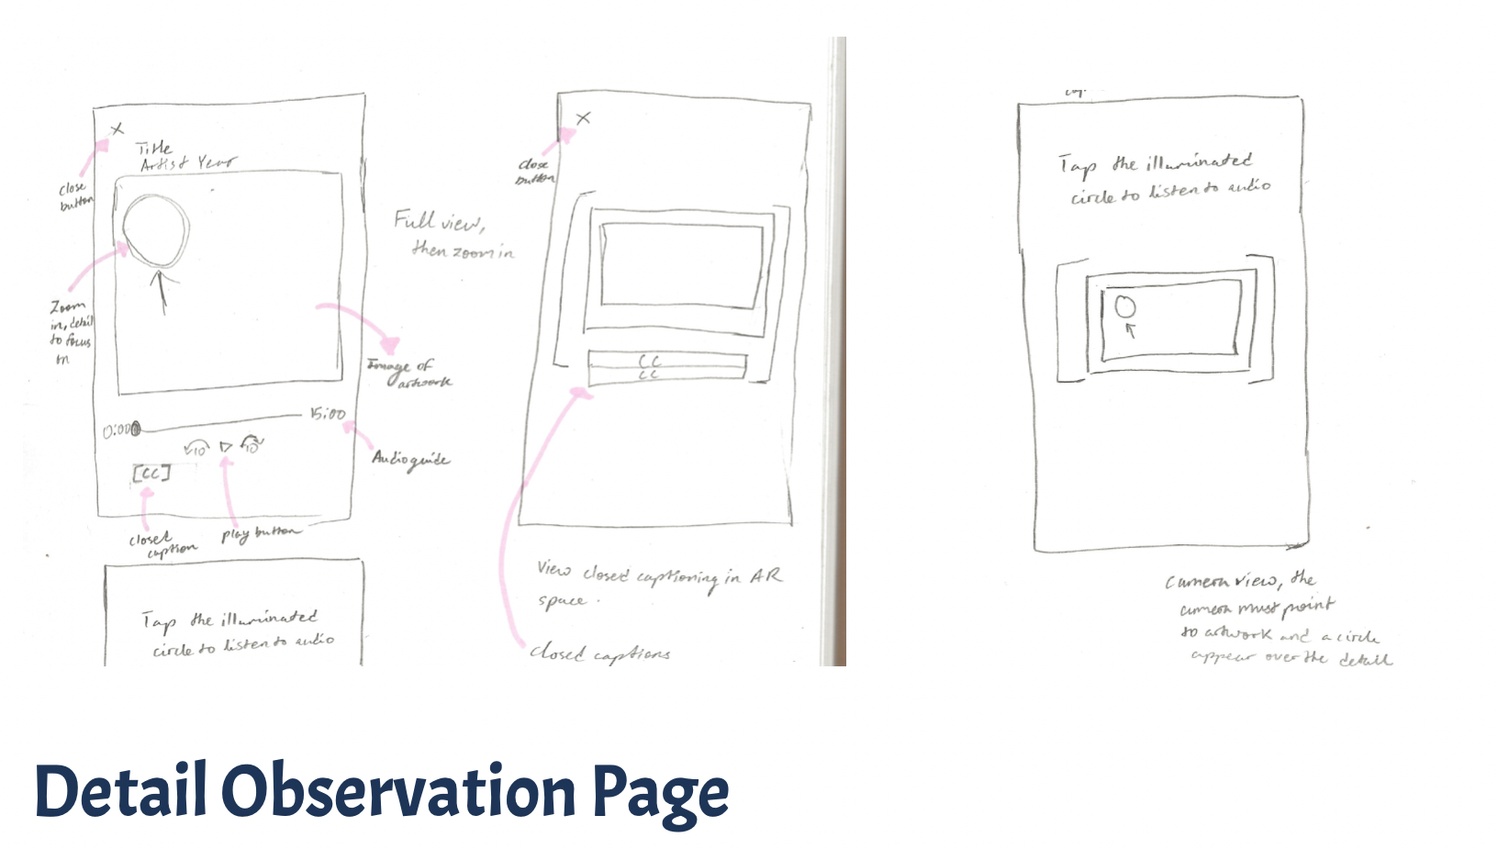
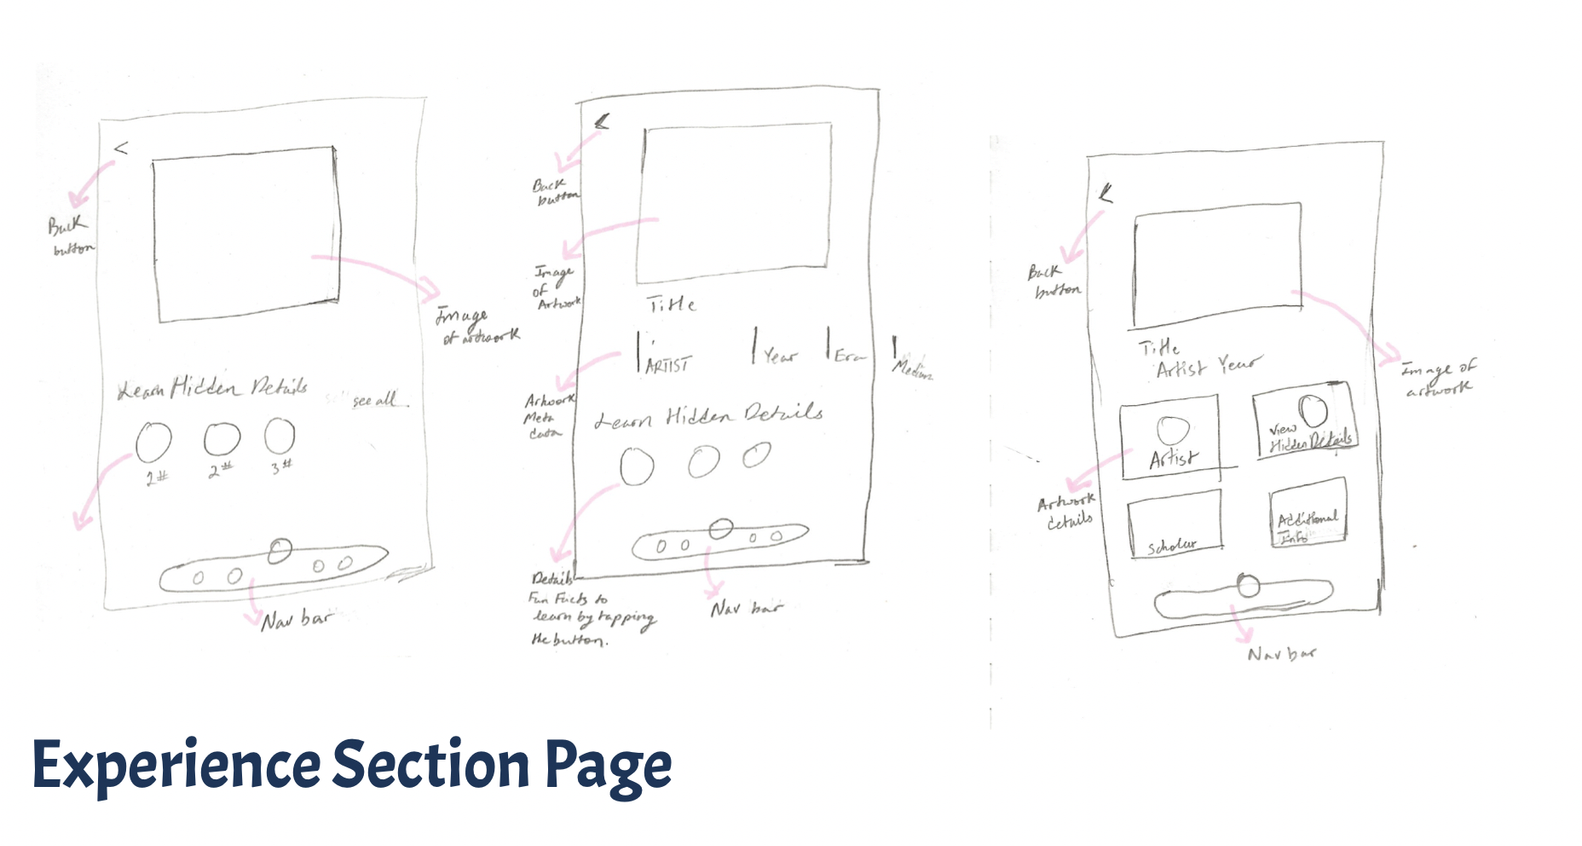
Learn about hidden details you may have missed in your first look, with an expert breakdown you can listen to.
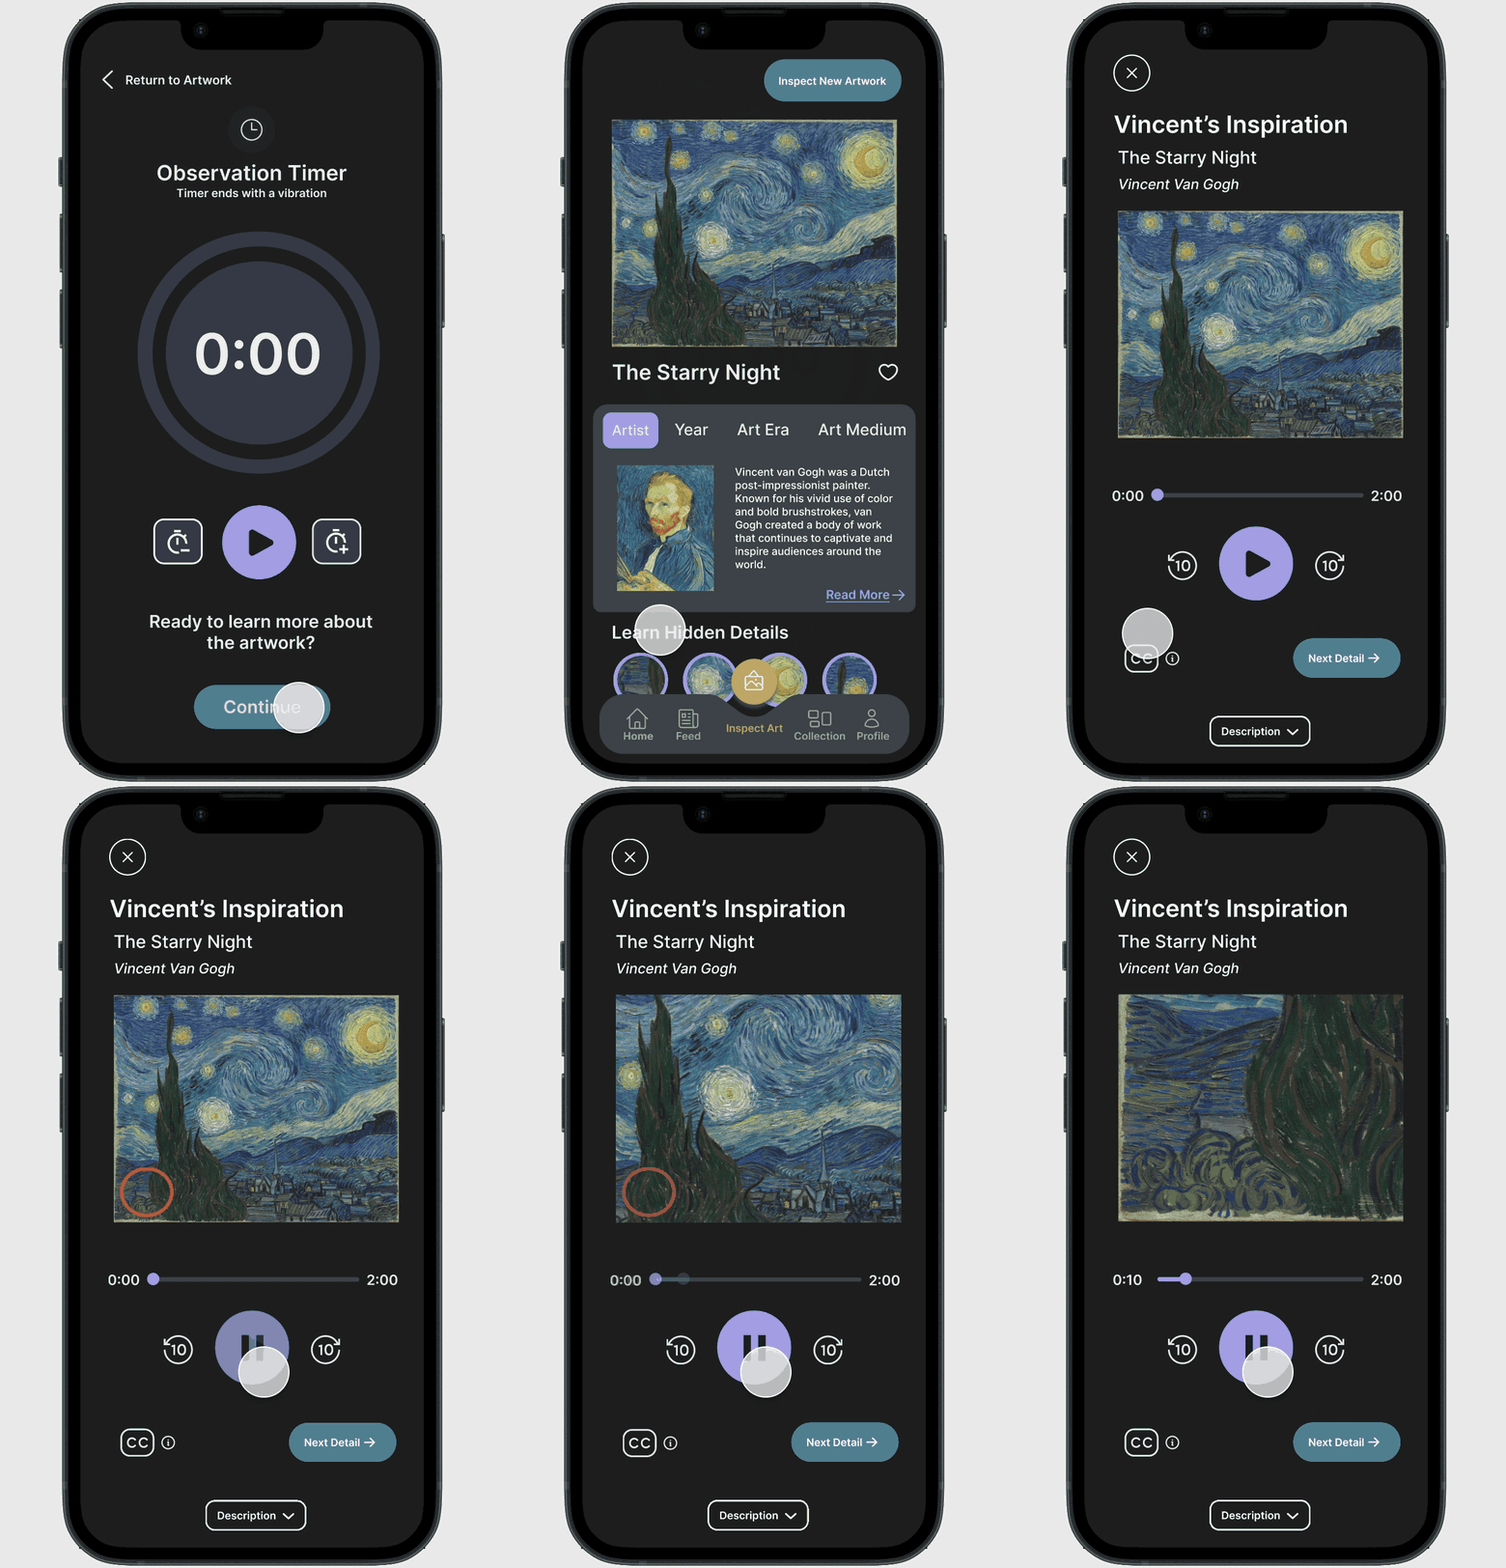
Exclusive images and AR
View the artwork outside the museum through ARtifacts-exclusive images, and blend digital with reality in AR.
How I solved it
How I solved it
Interviewing visitors and finding insights
My goals were to understand the current art museum experience, what draws people to museums or art experiences, and how to increase annual visitation. I ran four one-on-one interviews with people who had visited a NYC art museum in the last six months, so they could recall the visit well. I used affinity mapping to synthesize the interviews and found three insights: visitors want a balance of learning and joy, since a visit is a break from busy lives; how they observe and interact with art matters, with or without historical context; and they want to learn more than the plaque offers.
Defining the user
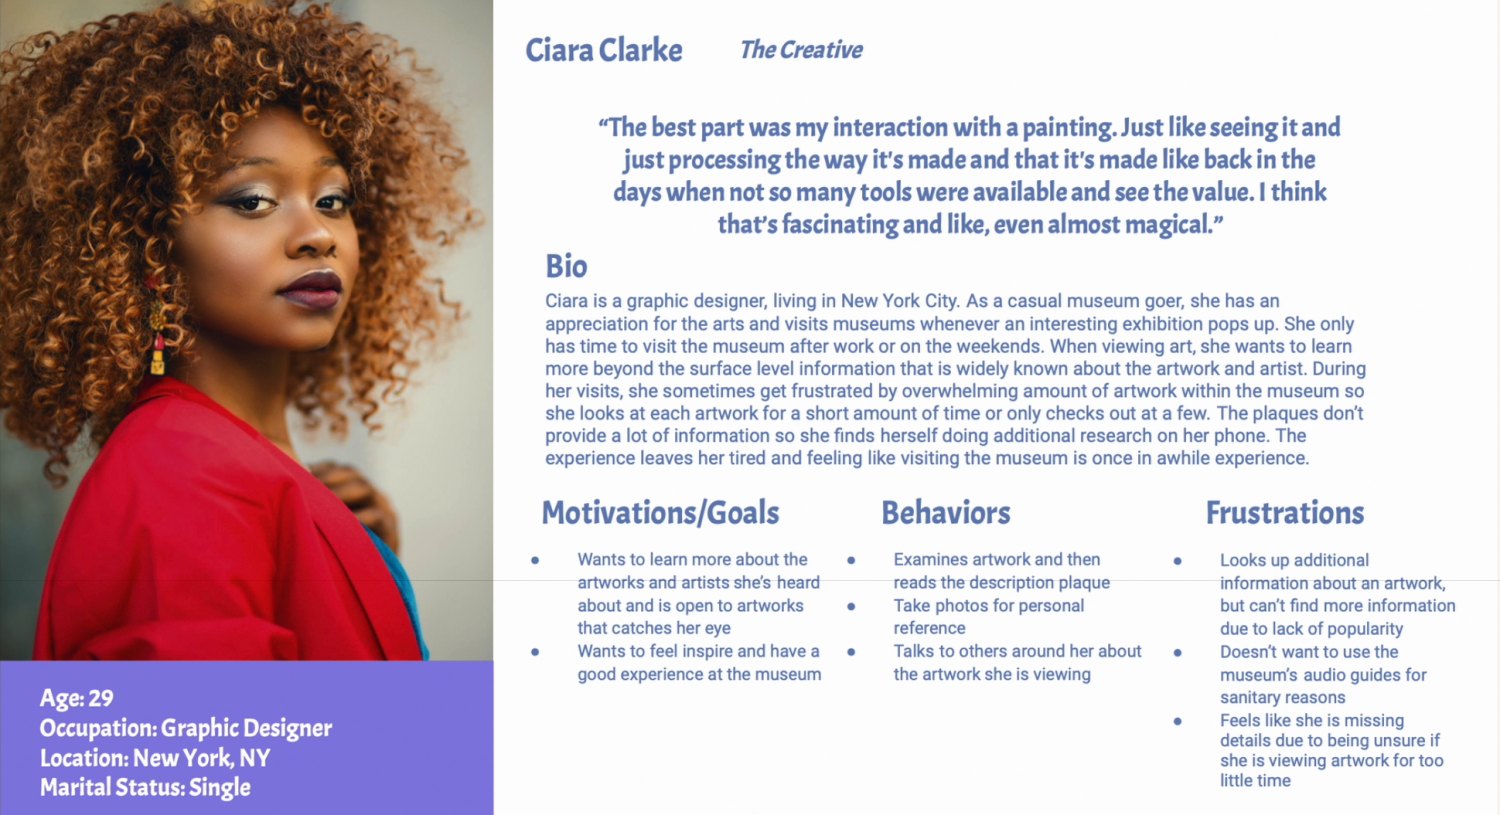
I created a persona to keep the visitor in mind while choosing a solution. Ciara is a 29-year-old graphic designer who visits when an exhibition catches her eye and wants to learn more about what she sees.
Choosing a direction
A how-might-we statement guided ideation: “How might we make a museum visit more engaging and memorable, so that more people want to visit?” I wrote user stories to brainstorm functionality from the persona’s view. Reaching twenty was hard, so I looked at other apps for patterns and features. The epic that best solved the question was Experience Enhancement: interactive, memorable digital experiences that deepen the connection to the artwork, with features only available inside the museum.
Mapping task flows
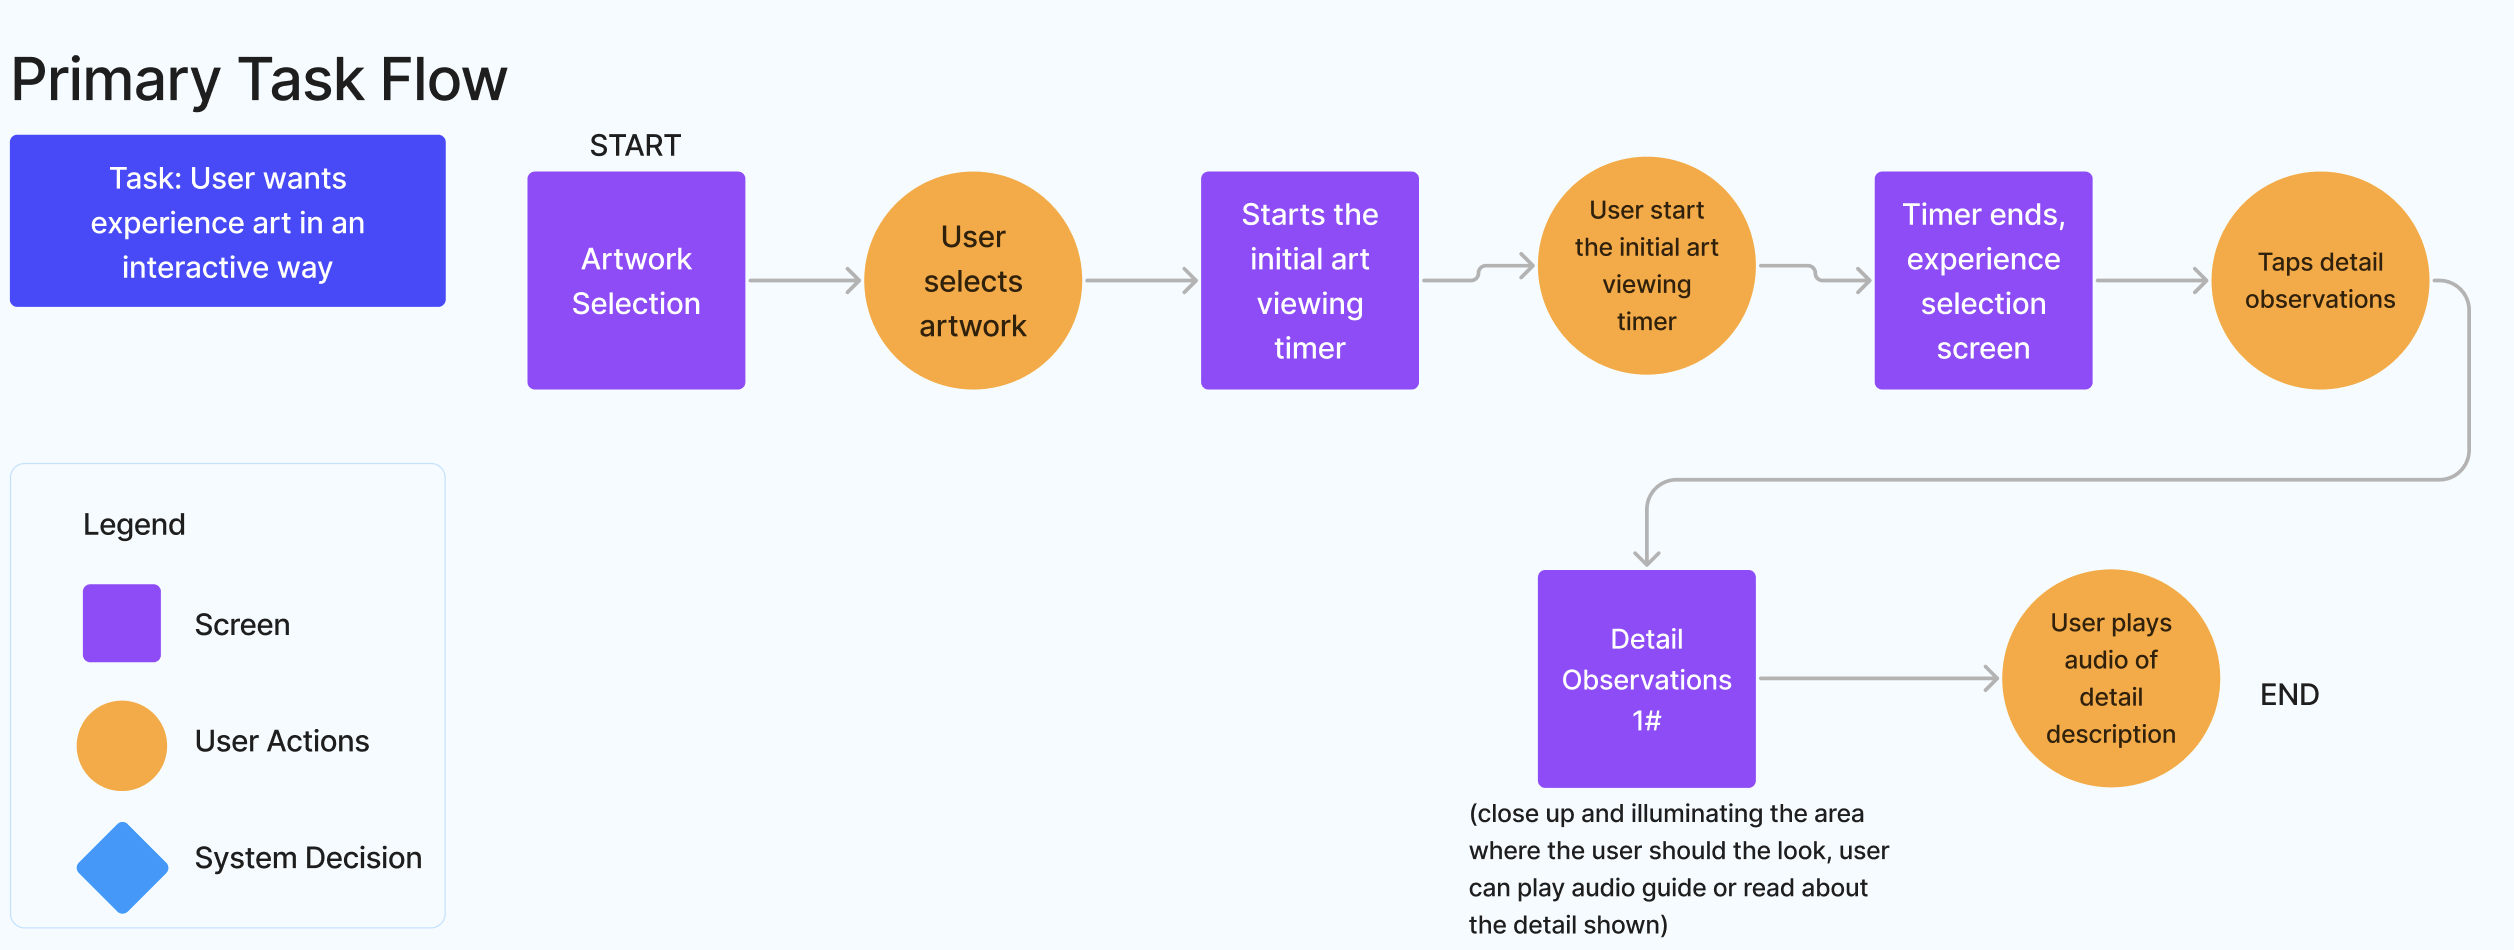
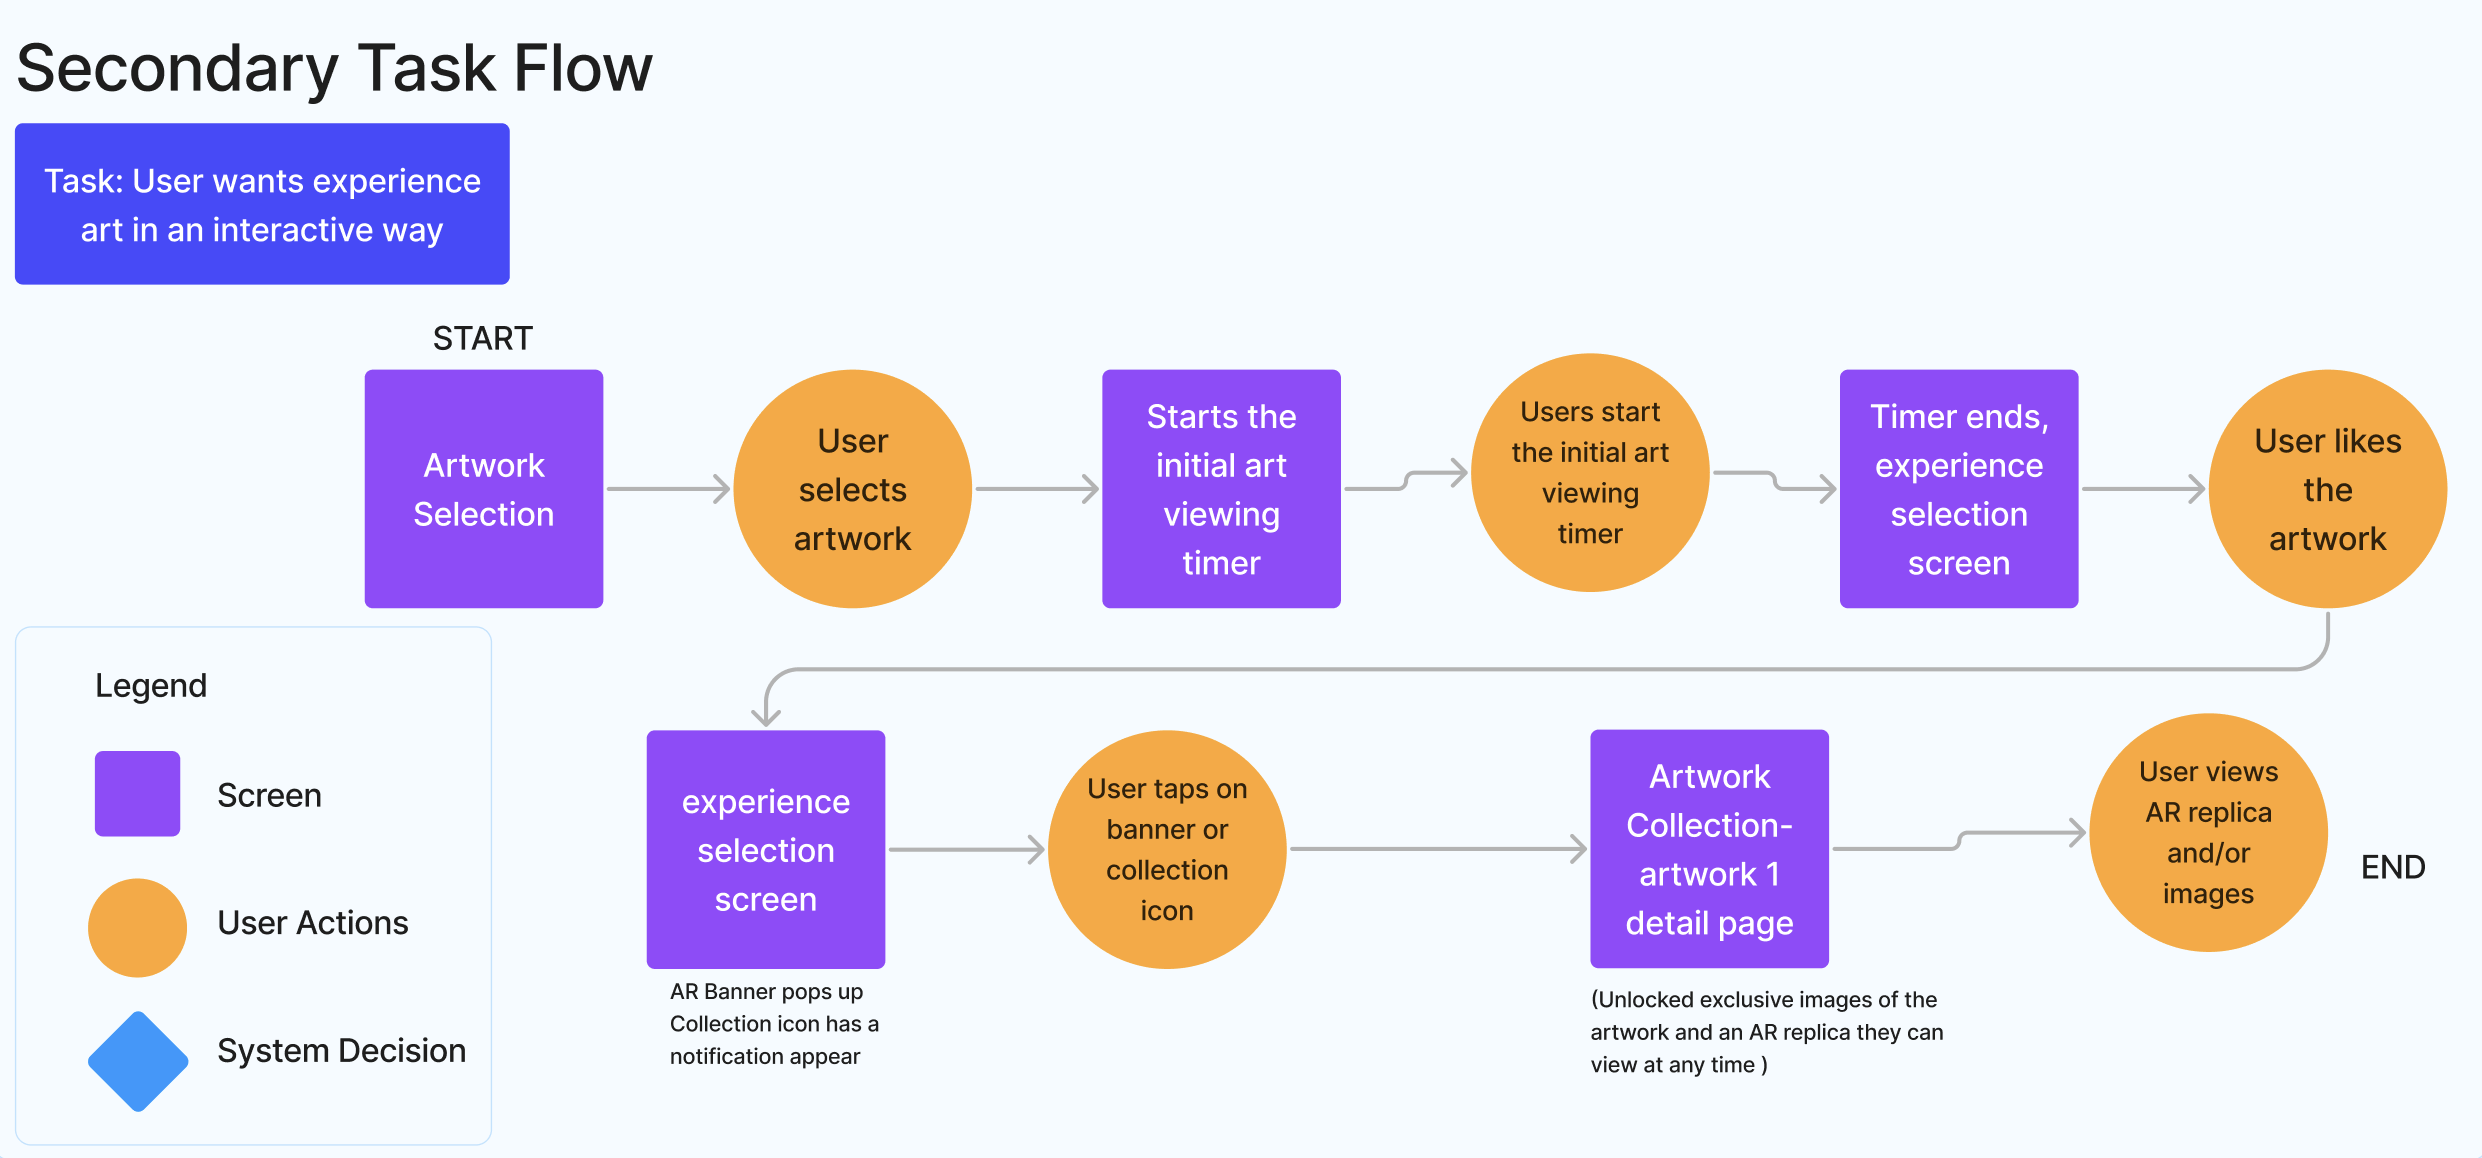
I built a primary flow, where a visitor interacts with the artwork in a meaningful way through the timer, detail observations and audio, and a secondary flow, where liking an artwork unlocks an AR replica and exclusive images.
Collecting UI inspiration
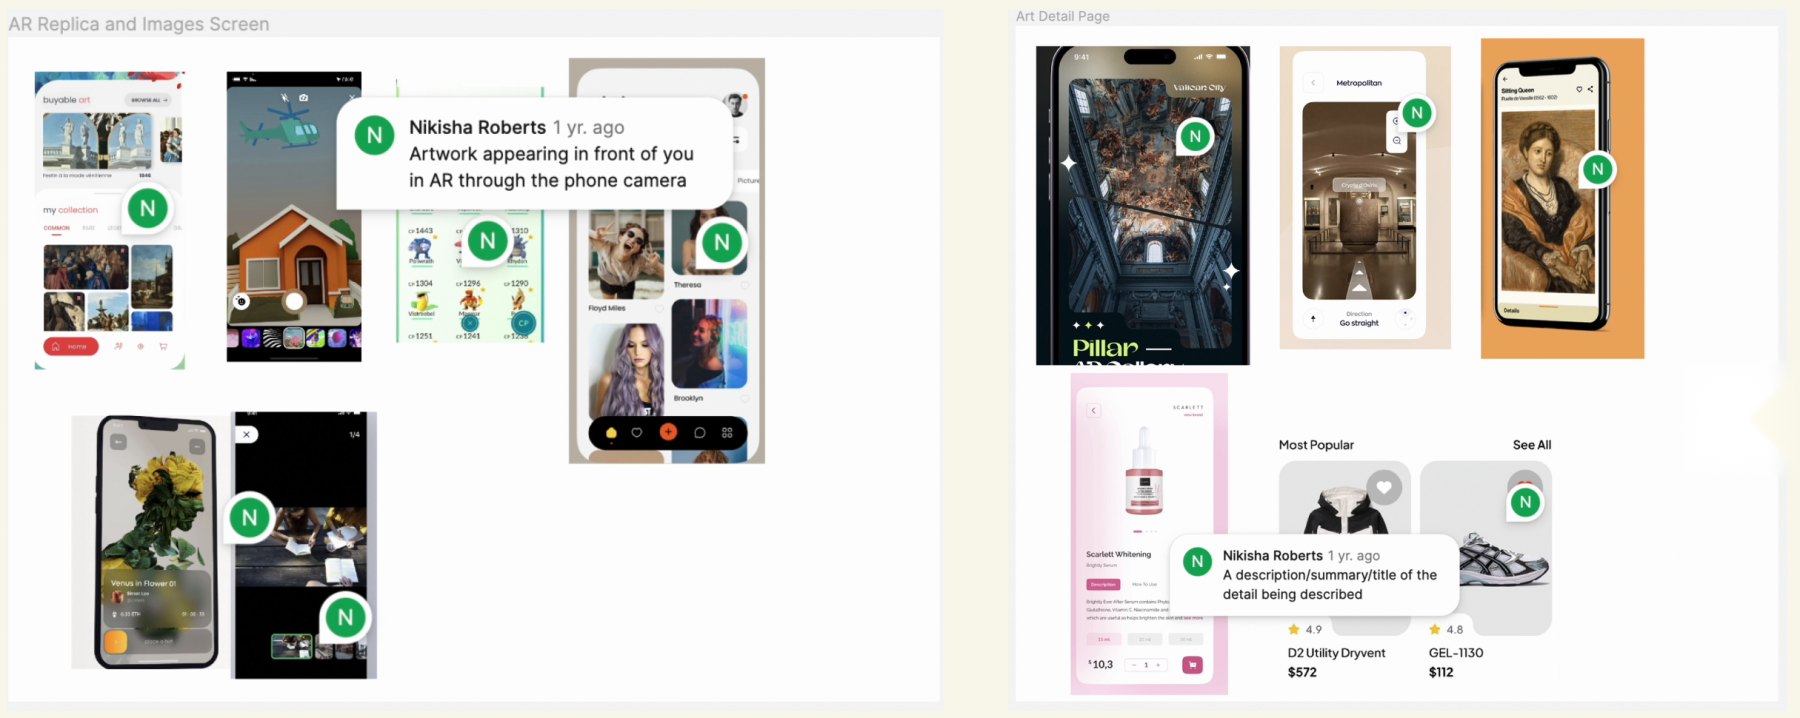
I made an inspiration board to see how the features from the user stories appear and work in current apps. It guided my sketches and later iterations.
Sketching, then prototyping
I used Crazy 8s to come up with ideas quickly, then refined a few sketches into a guide for the Figma prototype. The proposal: let users learn more about the artwork through a series of experiences.
Building the high-fidelity design
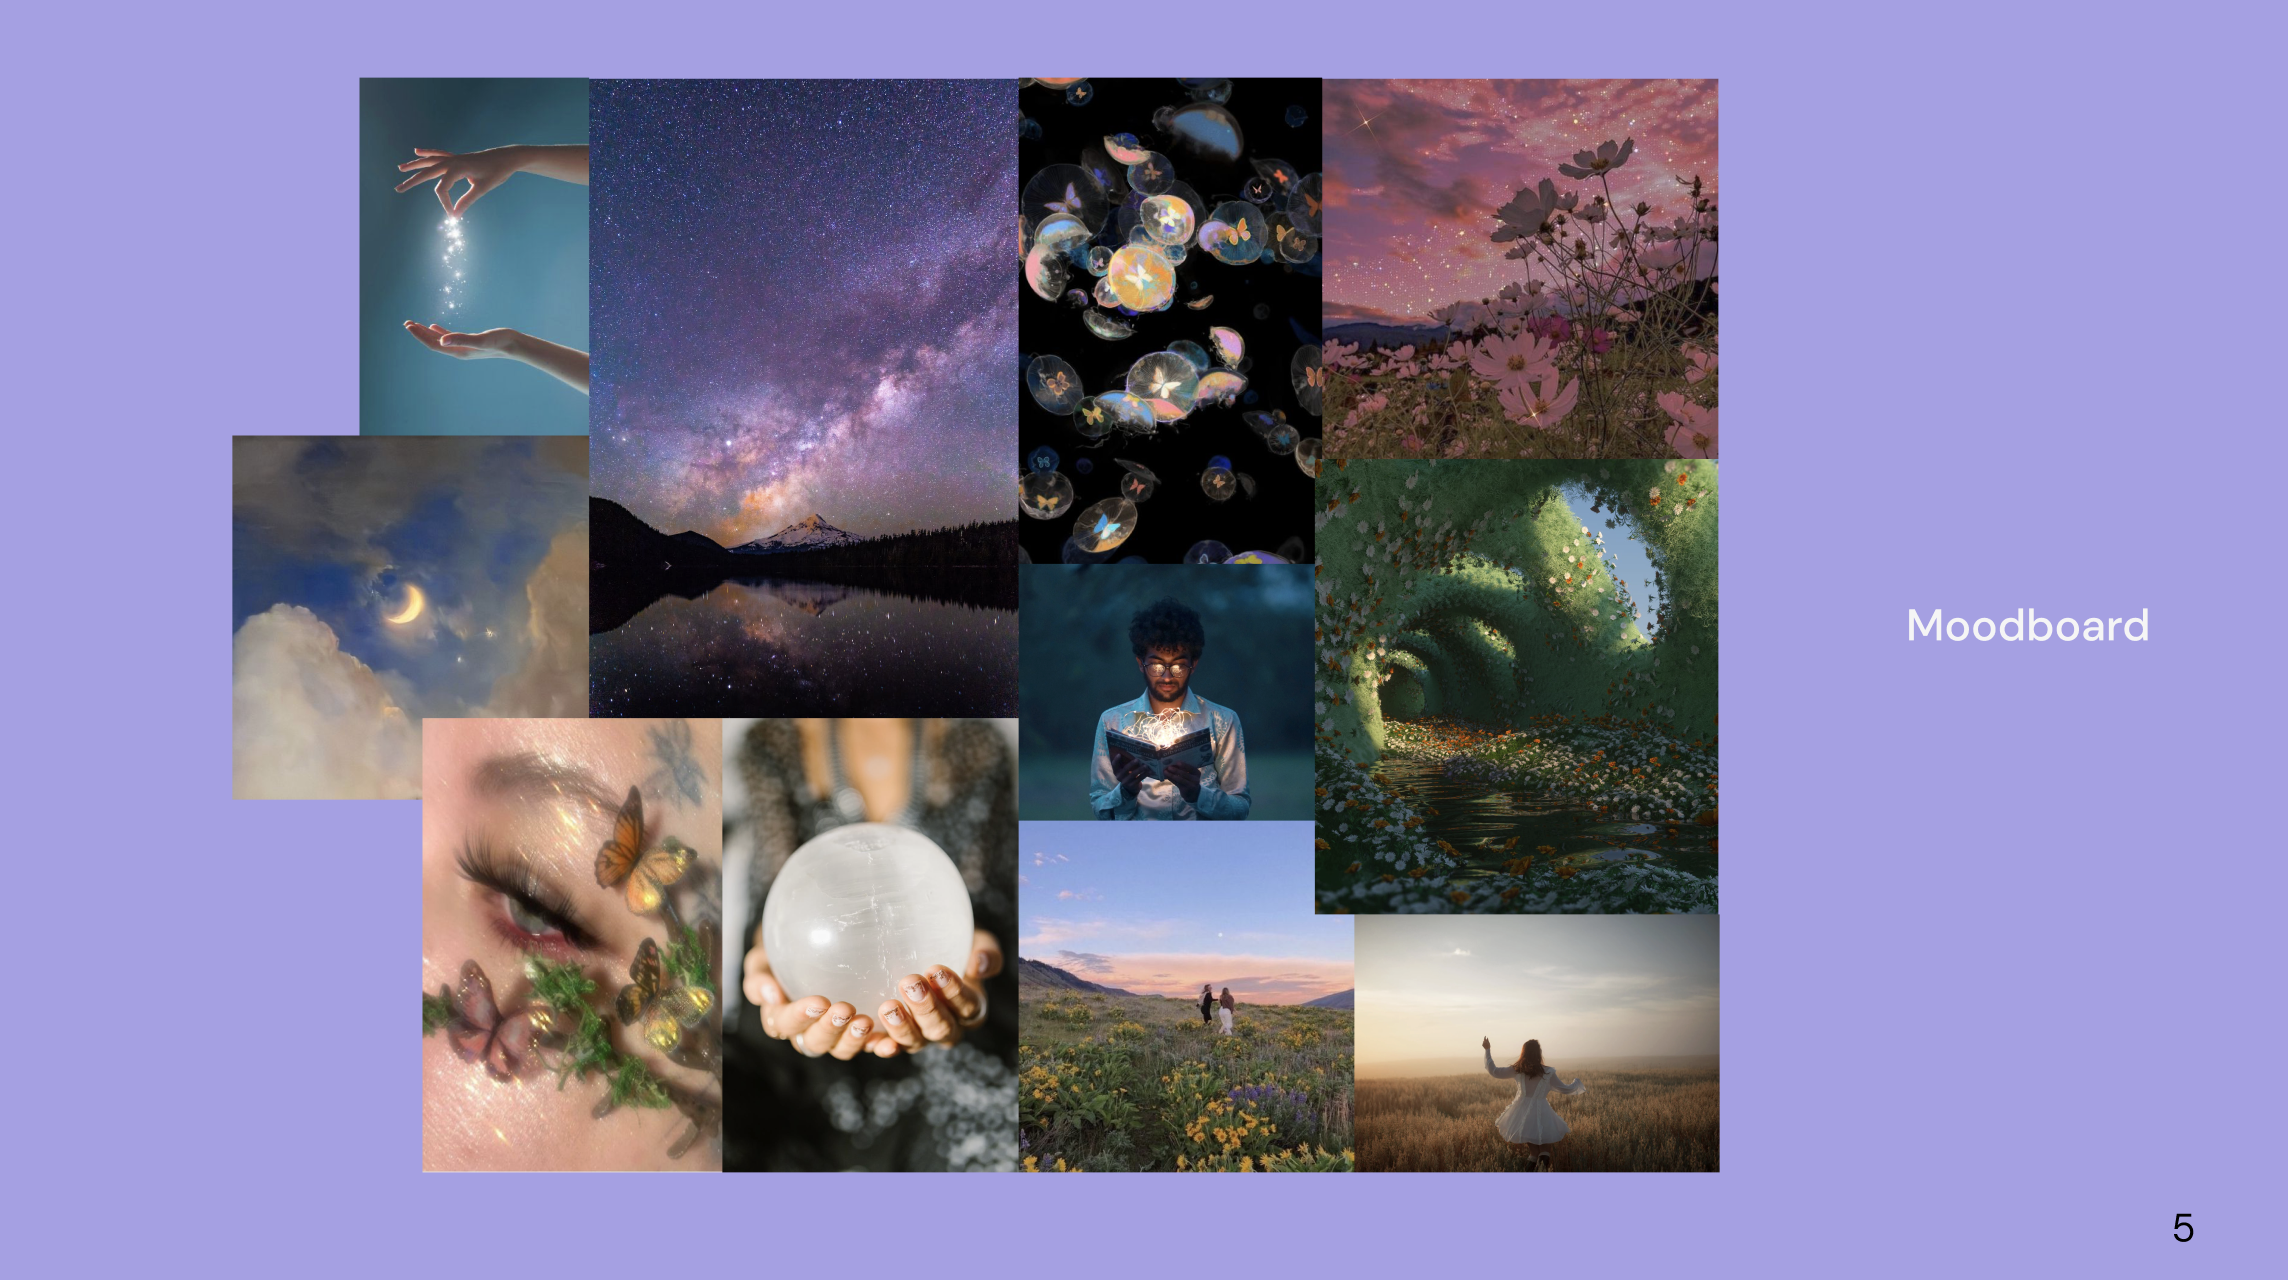
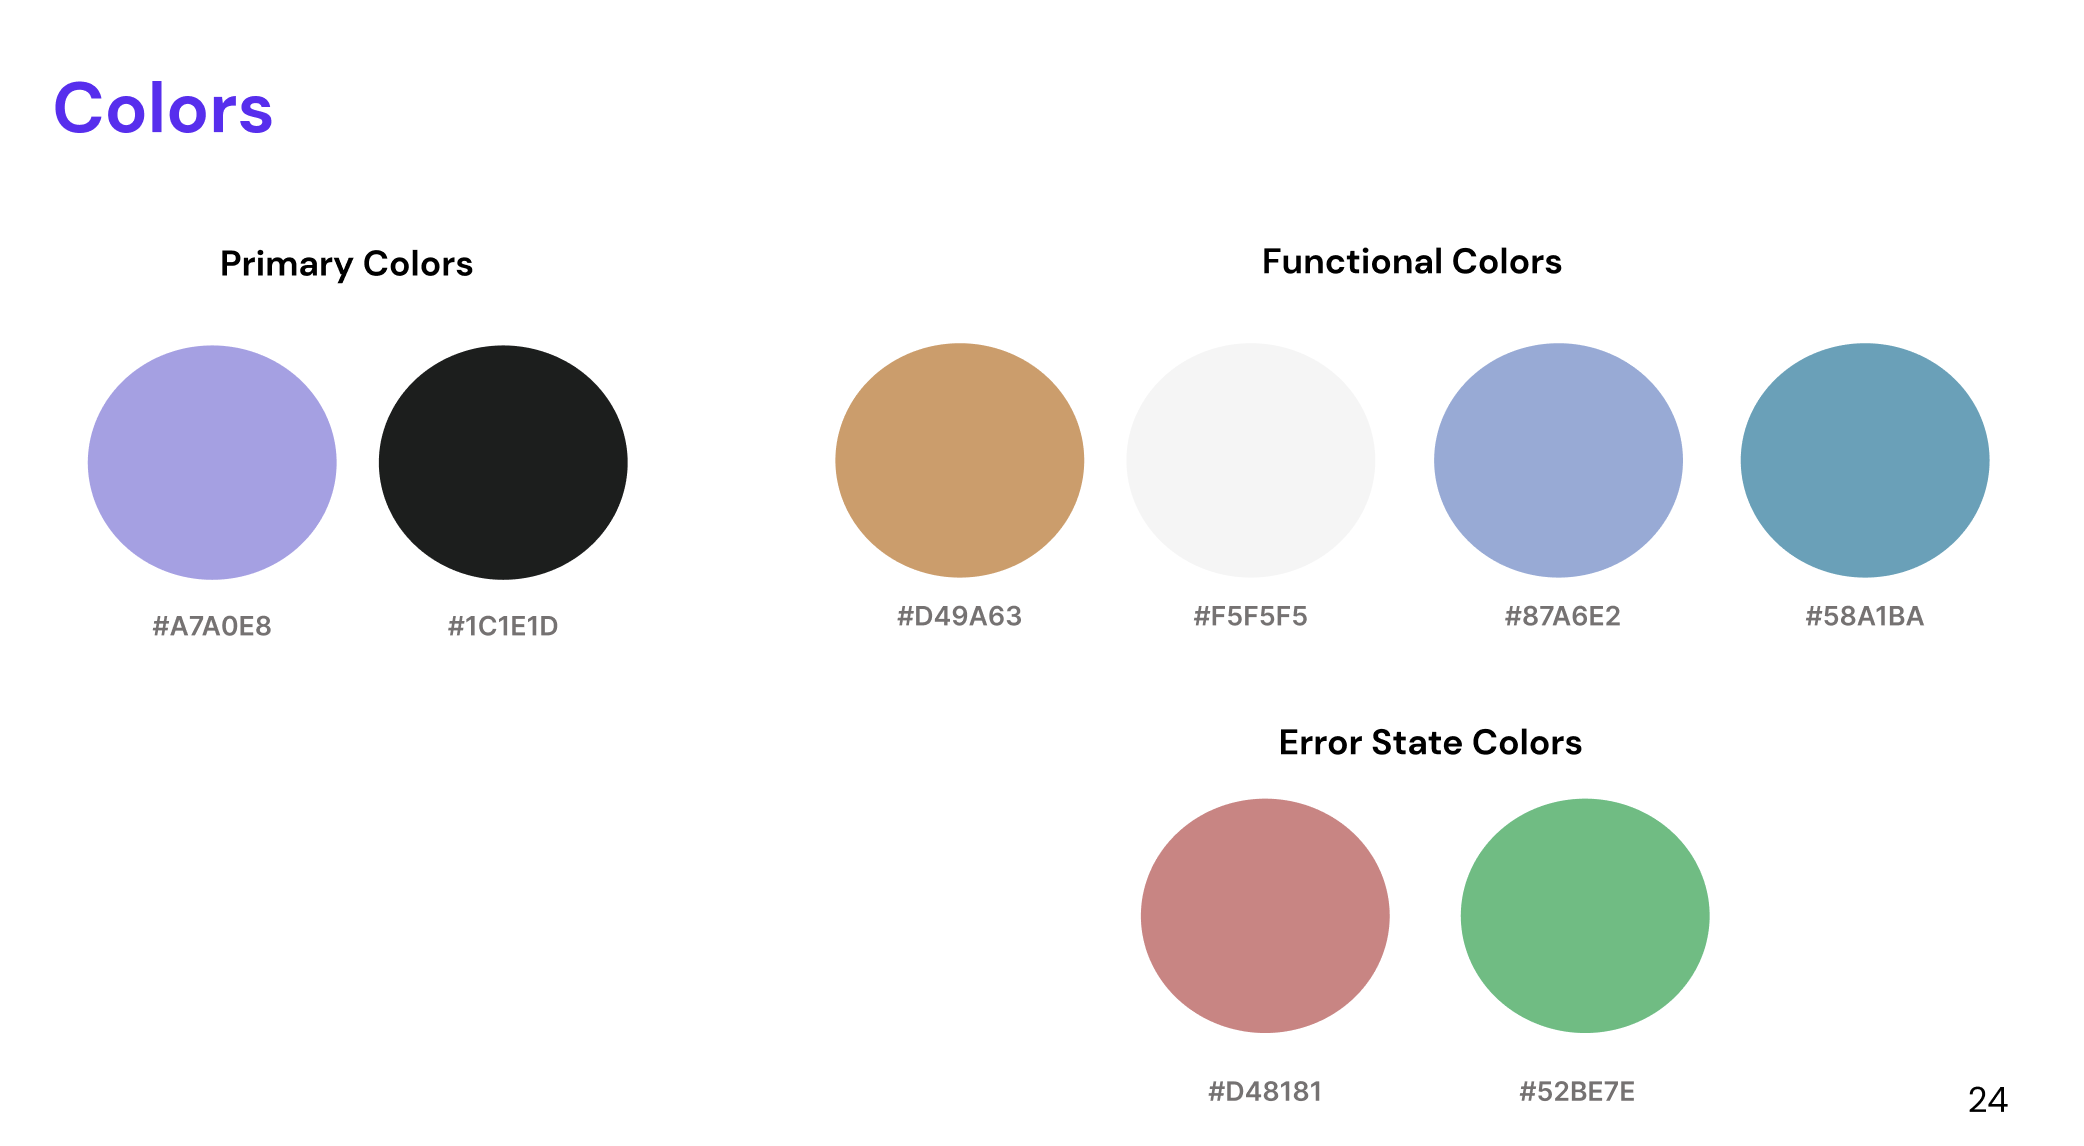
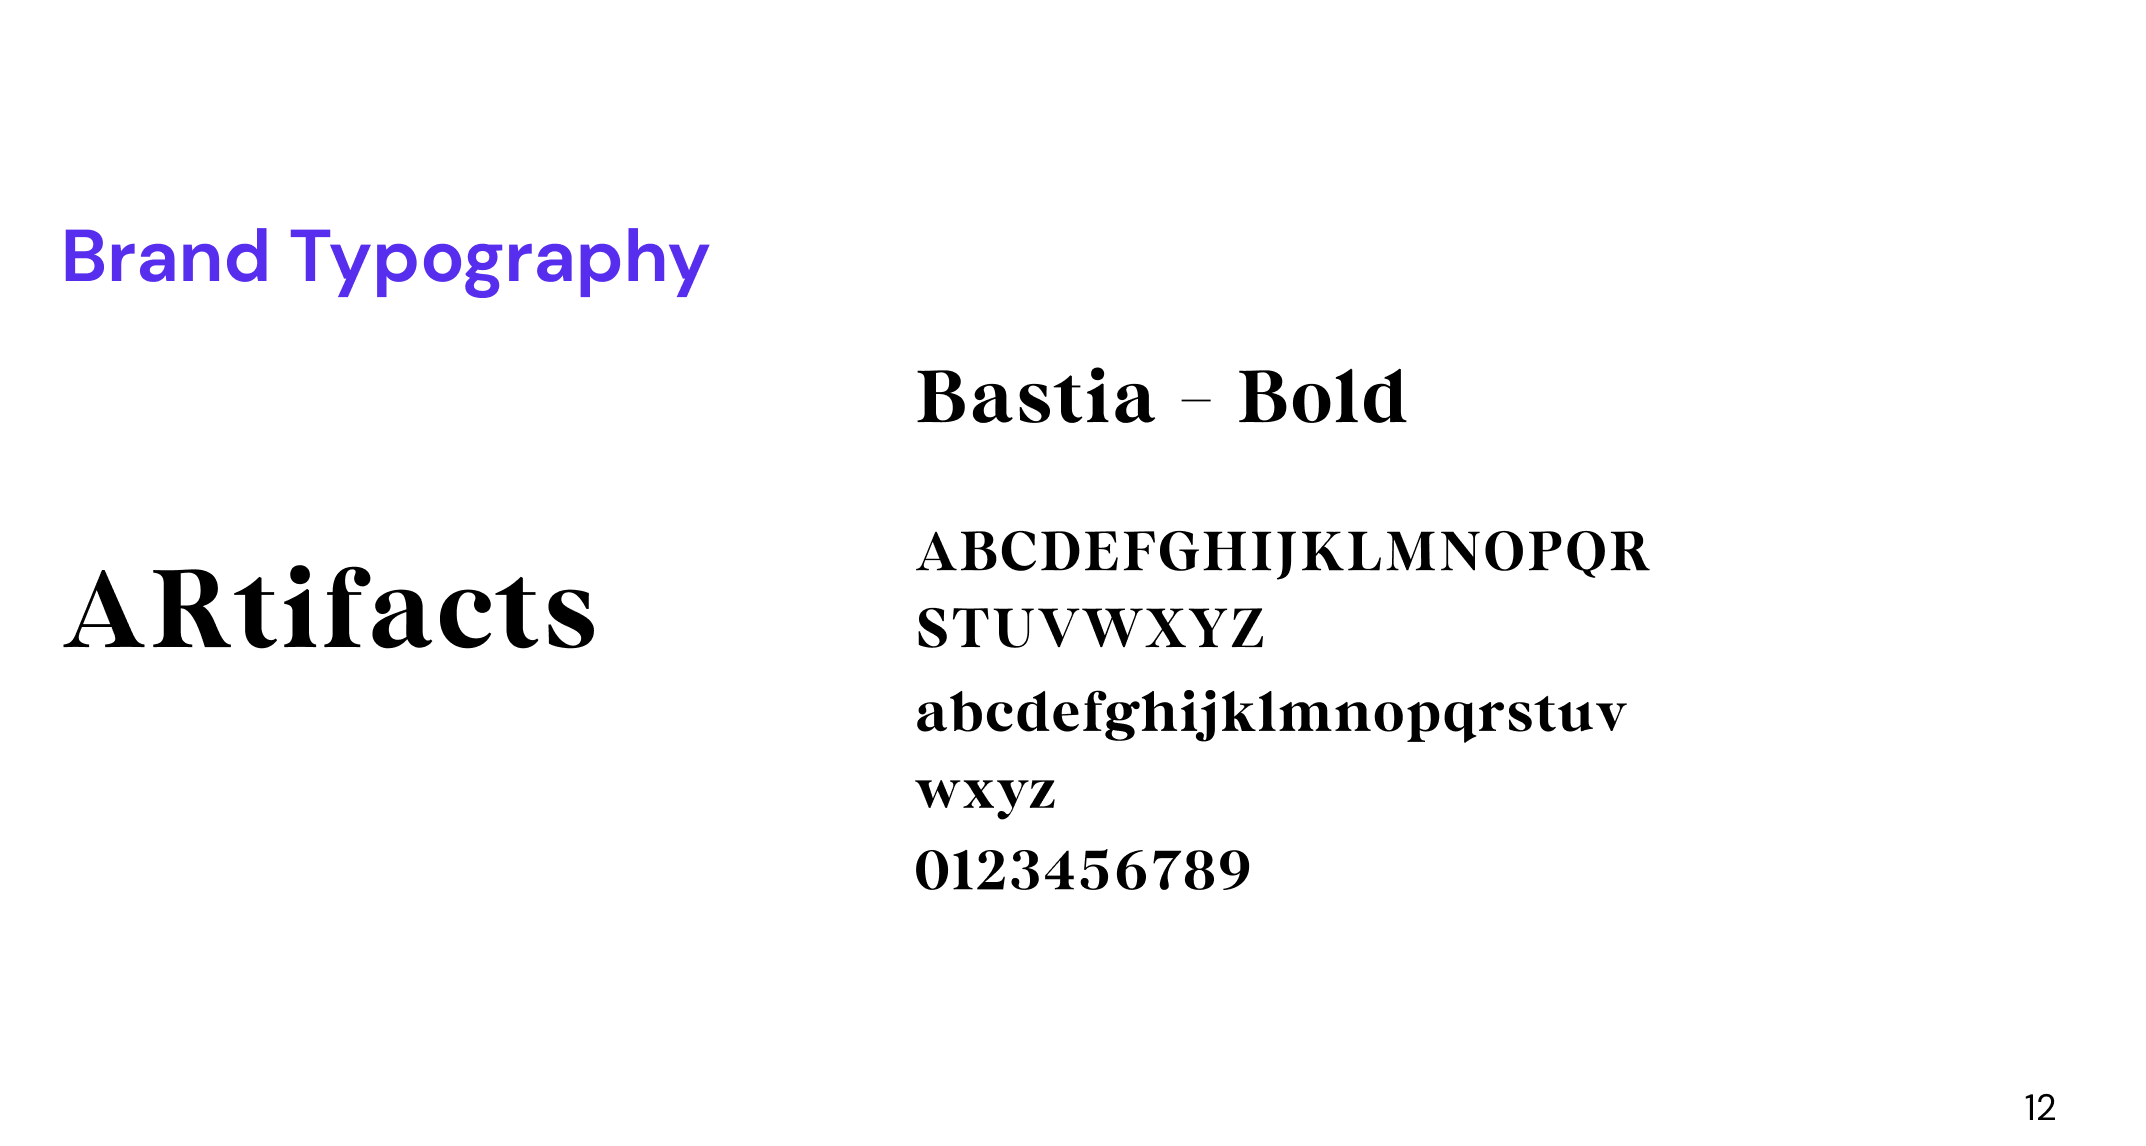
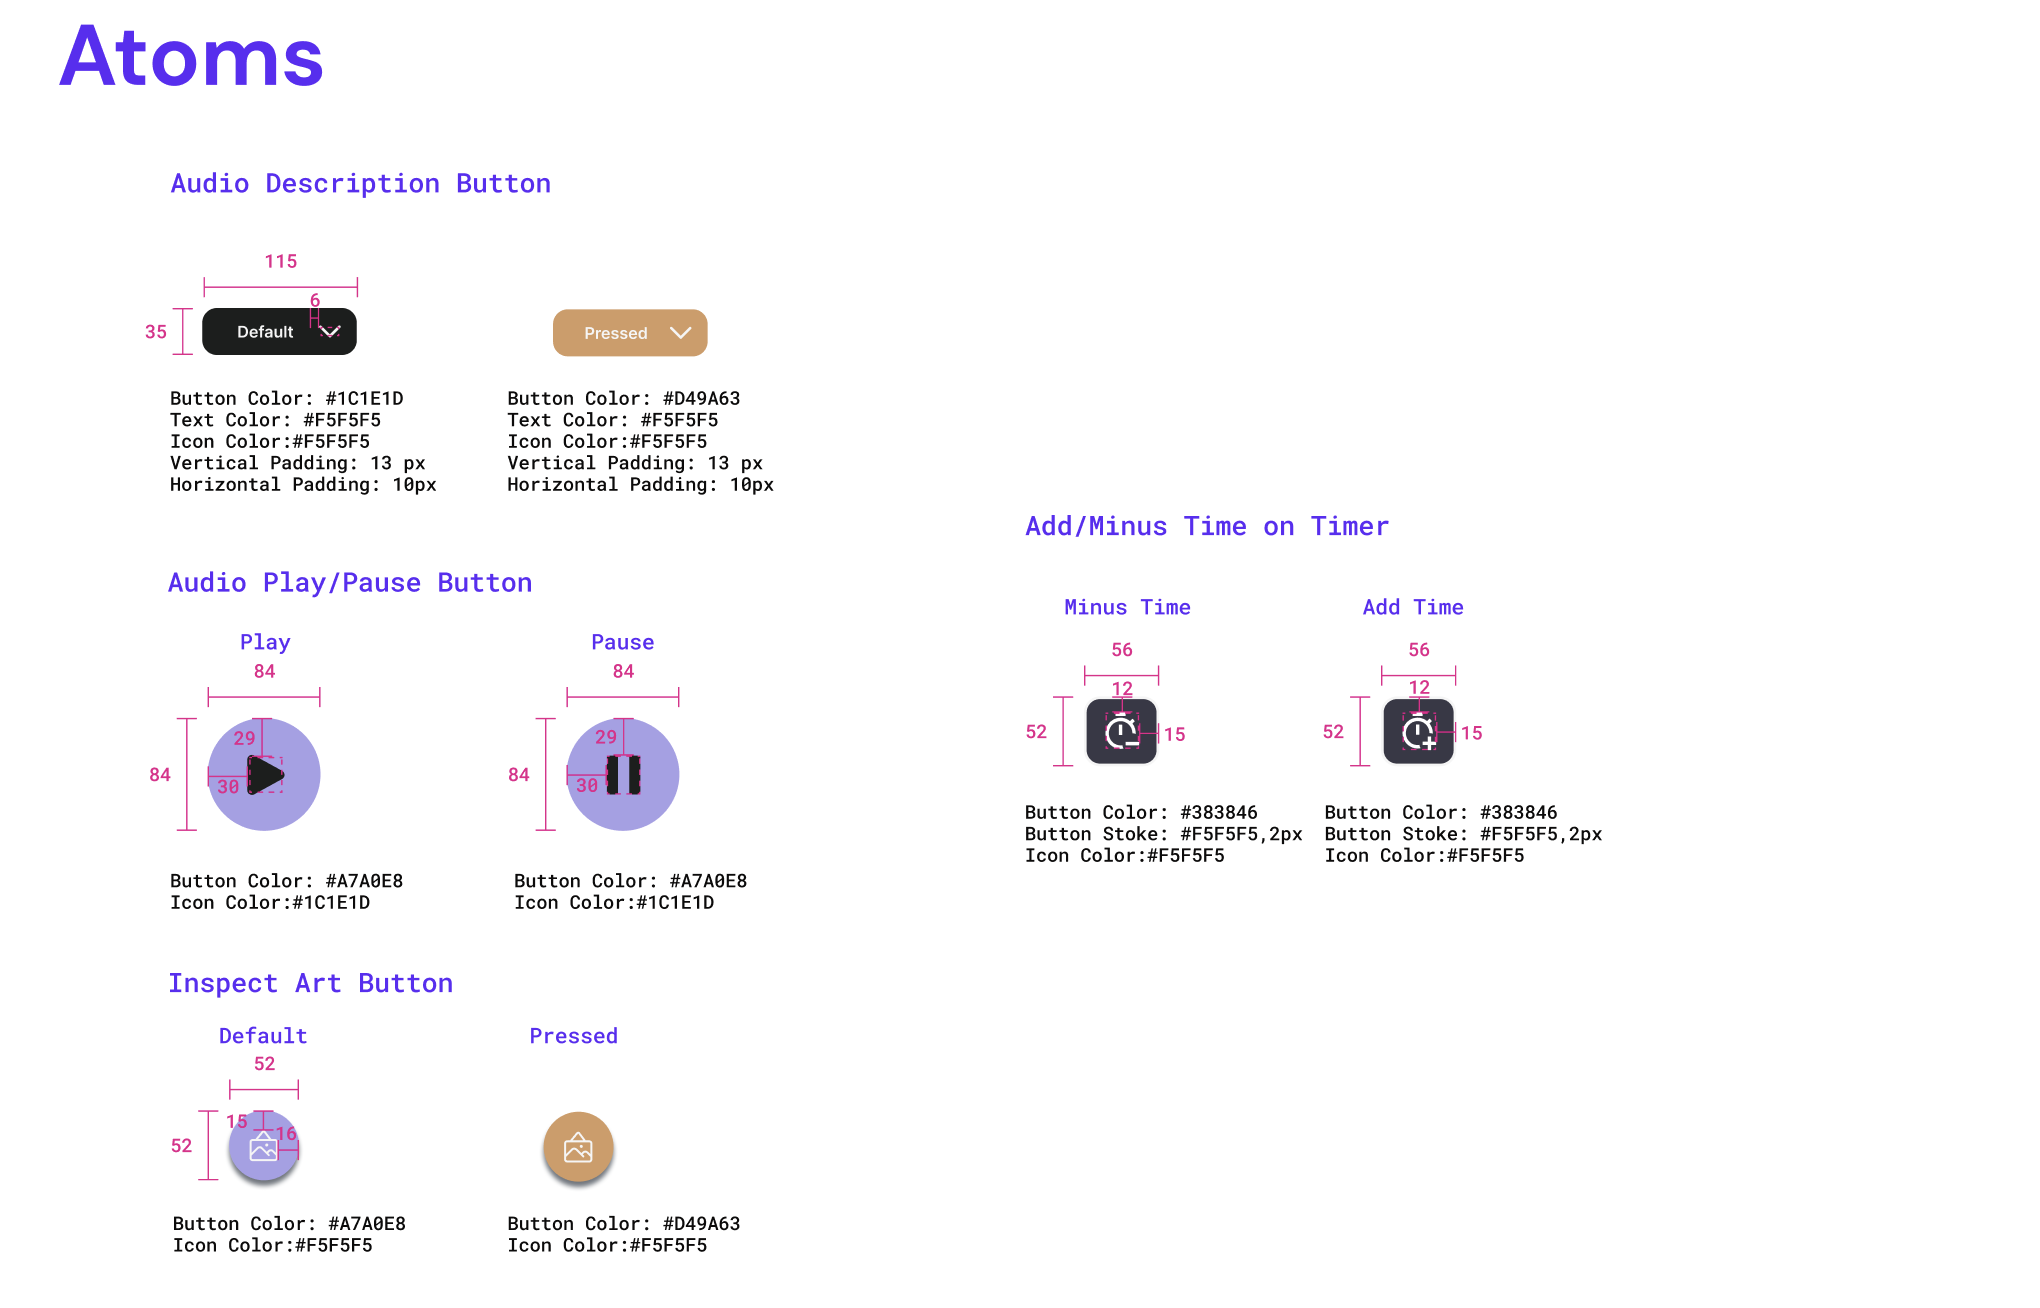
I chose the brand name, typography and colors, and specified the UI components. Testing showed my first prototype was less intuitive than I thought: users struggled to complete the task flows, and their feedback made the high-fidelity version more effective.
Outcomes
Impact
The prospective impact of ARtifacts is an increase in visitor satisfaction and attendance at museums across New York City, which means more ticket sales and more spending on gift shops, special exhibitions and food. It could also bring greater public interest in AR and new investment by museums in using AR to archive artwork, making art history more accessible and encouraging more people to engage with art, especially lesser-known work.
Key takeaways
Trust the process
I started with few ideas for a design intervention, and user interviews scrapped them. Using the frameworks from my bootcamp and past internships, I produced a product I’m proud of.
Testing matters
My first prototype was not as intuitive as I thought. User feedback made the high-fidelity design more effective.
The magic of 0-1
I enjoy taking a problem and an idea on paper and seeing it become a tangible product. Design is about the journey and the people you meet along the way.