TL;DR
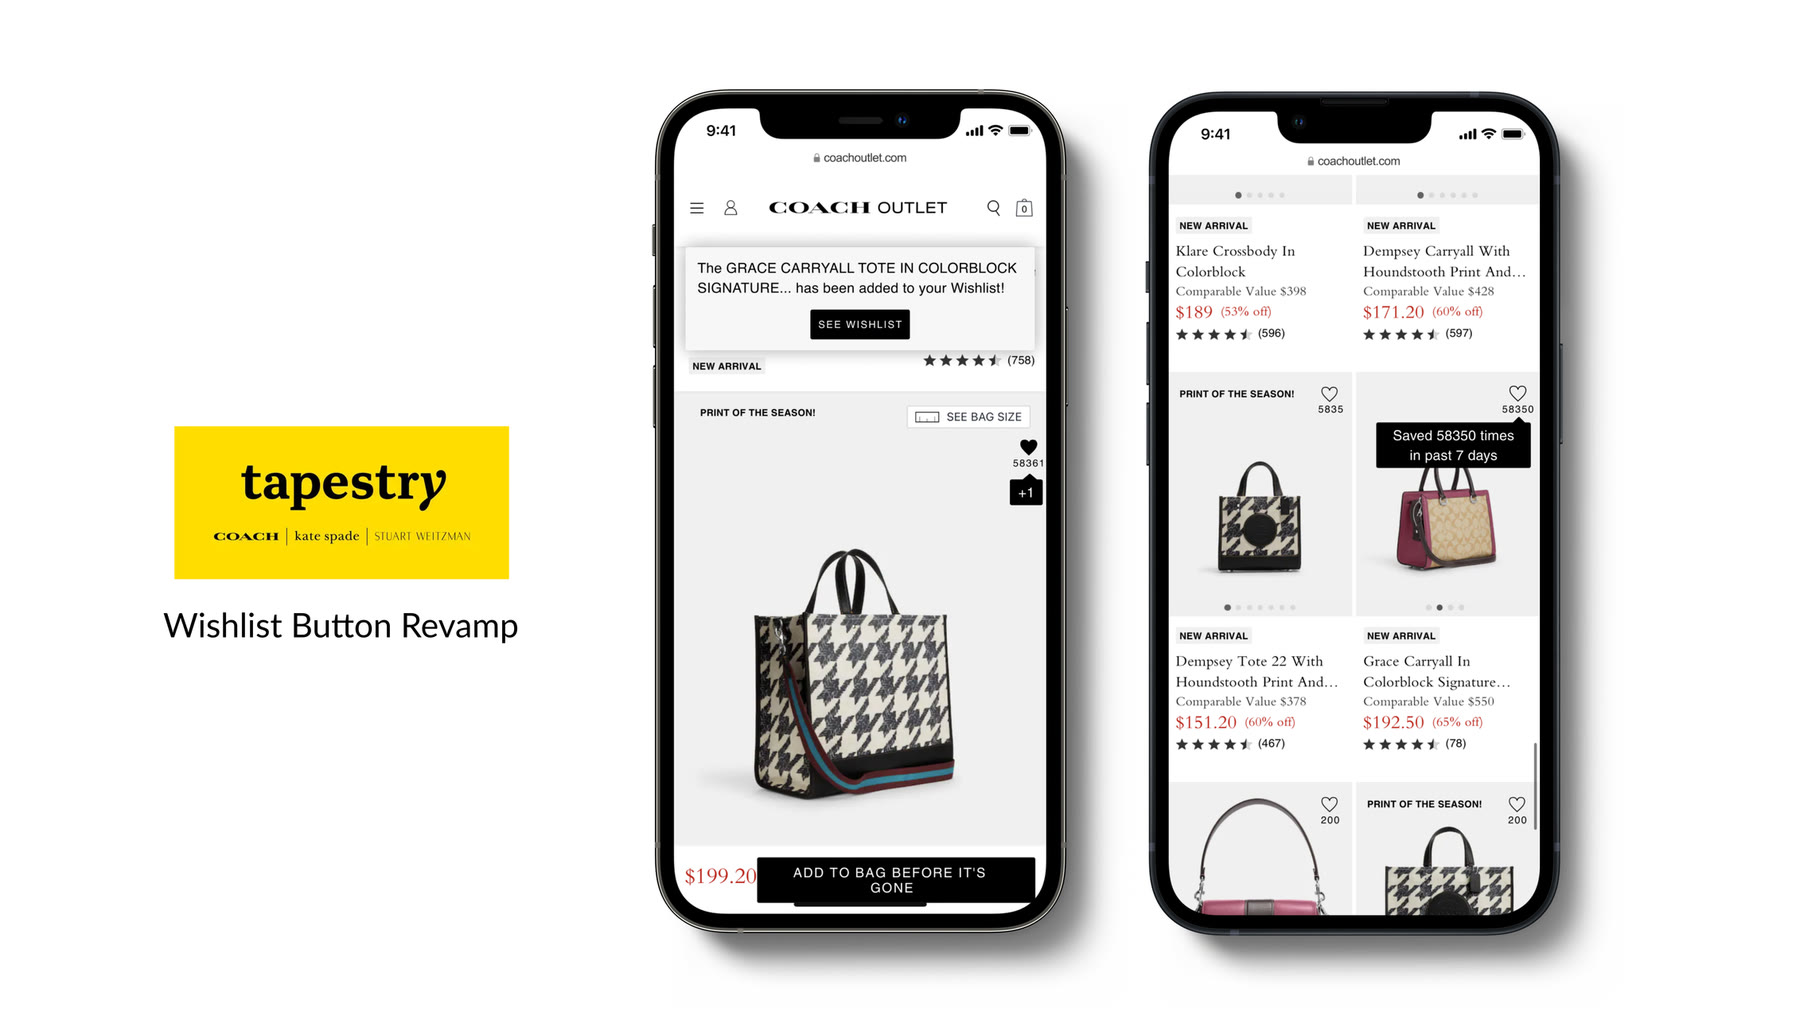
On Tapestry’s (the parent company of Coach, Kate Spade and Stuart Weitzman) testing and innovation team, I proposed an A/B test that makes the like button visible and social, to increase conversions. I ran a stakeholder brainstorm, prioritized the ideas and delivered the test plan, which was added to the product roadmap. The control beat the variations, and the team saw the value of testing the like button further by investing in external vendors for continued testing.
Problem
Problem
The testing team runs A/B and multivariate tests across the brand sites. As a summer intern, I delivered two testing plans for the roadmap, and this case study covers one of them.
Constraint
Test plans had to be ideas the team had not tested before. My work is under NDA, so data values, percentages and roadmap details are left out, and any numbers shown are dummy numbers.
Key challenges
Engagement
Brand websites did not feel as engaging as Instagram, Facebook or TikTok.
Low use, high impact
Google Analytics showed only a small number of users use the like button, yet it drove a significant amount of conversions.
Brand approval
At least one brand team must approve a test idea before it can run on their site.
Solution
Visible like counts
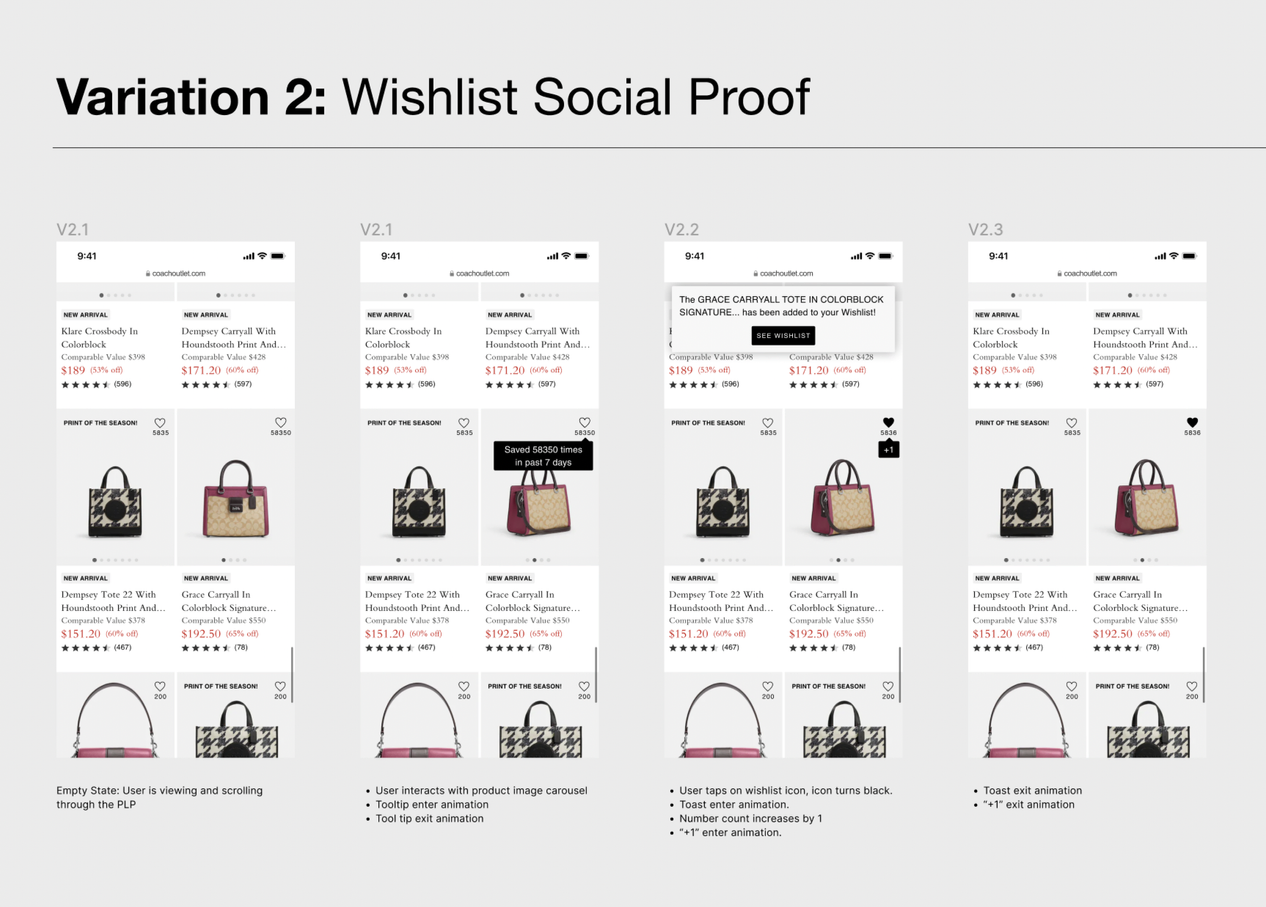
Show the number of users who liked a product on each product page and product tile, as social proof that can entice a purchase.
Tooltip awareness
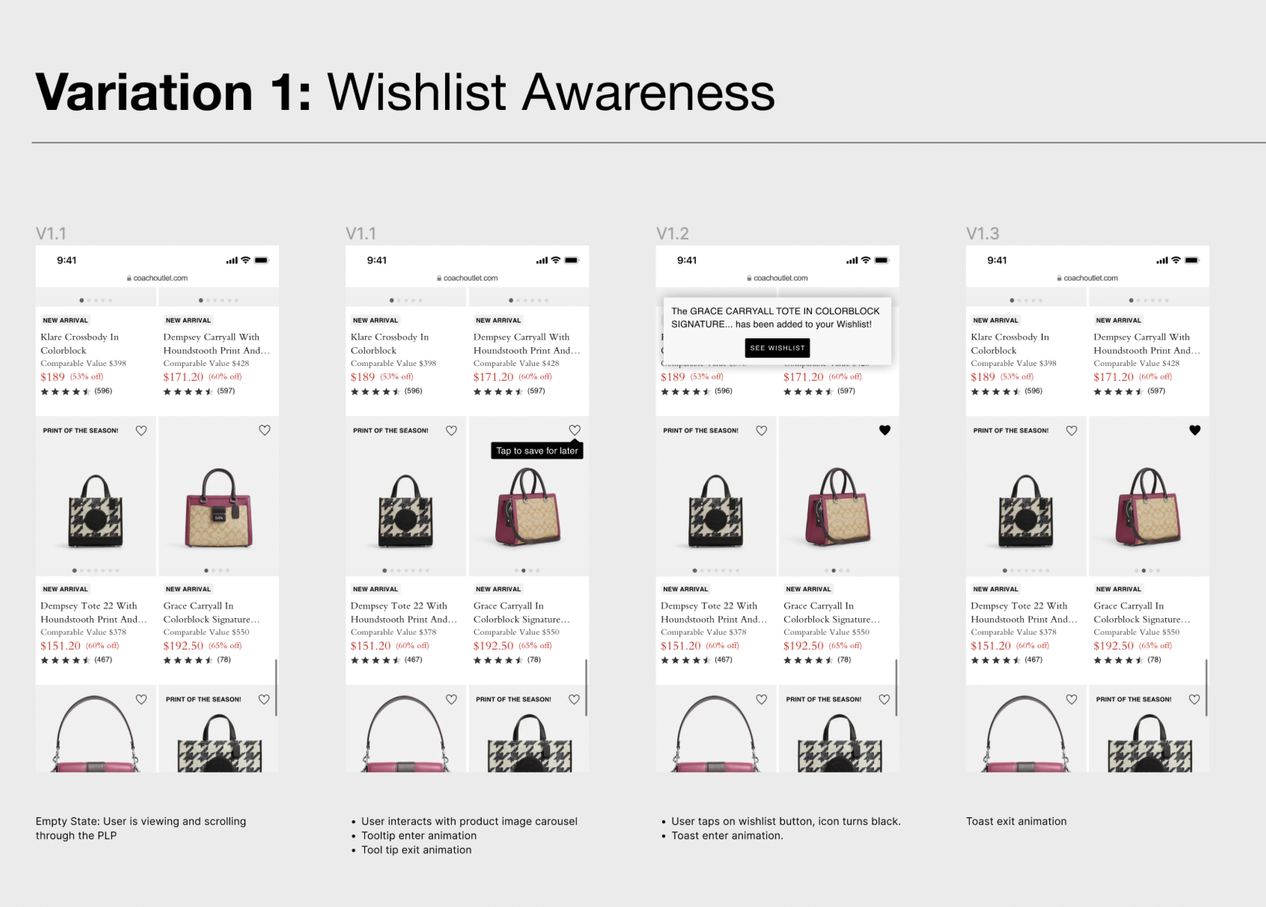
A second variation adds a tooltip that points out the like button. It came from collaborating with UX.
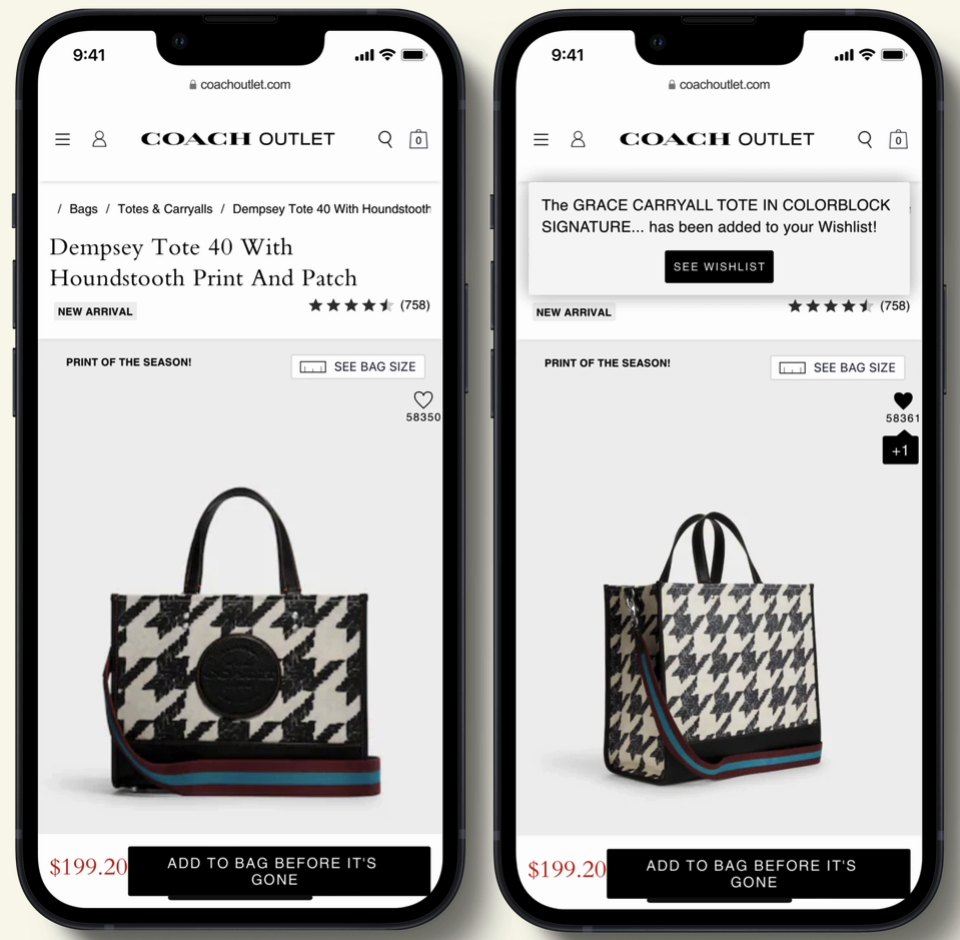
Wishlist confirmation
Tapping the heart turns it solid and shows a toast that the item was added, with a link to the wishlist.
A +1 moment
The count goes up by one with a small animation to reward the tap.
How I solved it
How I solved it
Starting from the roadmap
I reviewed the Tapestry Digital roadmap and the quarter’s goals to find areas of interest and to prioritize brand teams. With my manager, I wrote a how-might-we statement: how might we make our website experience feel as engaging as Instagram, Facebook and TikTok?
Running a stakeholder brainstorm
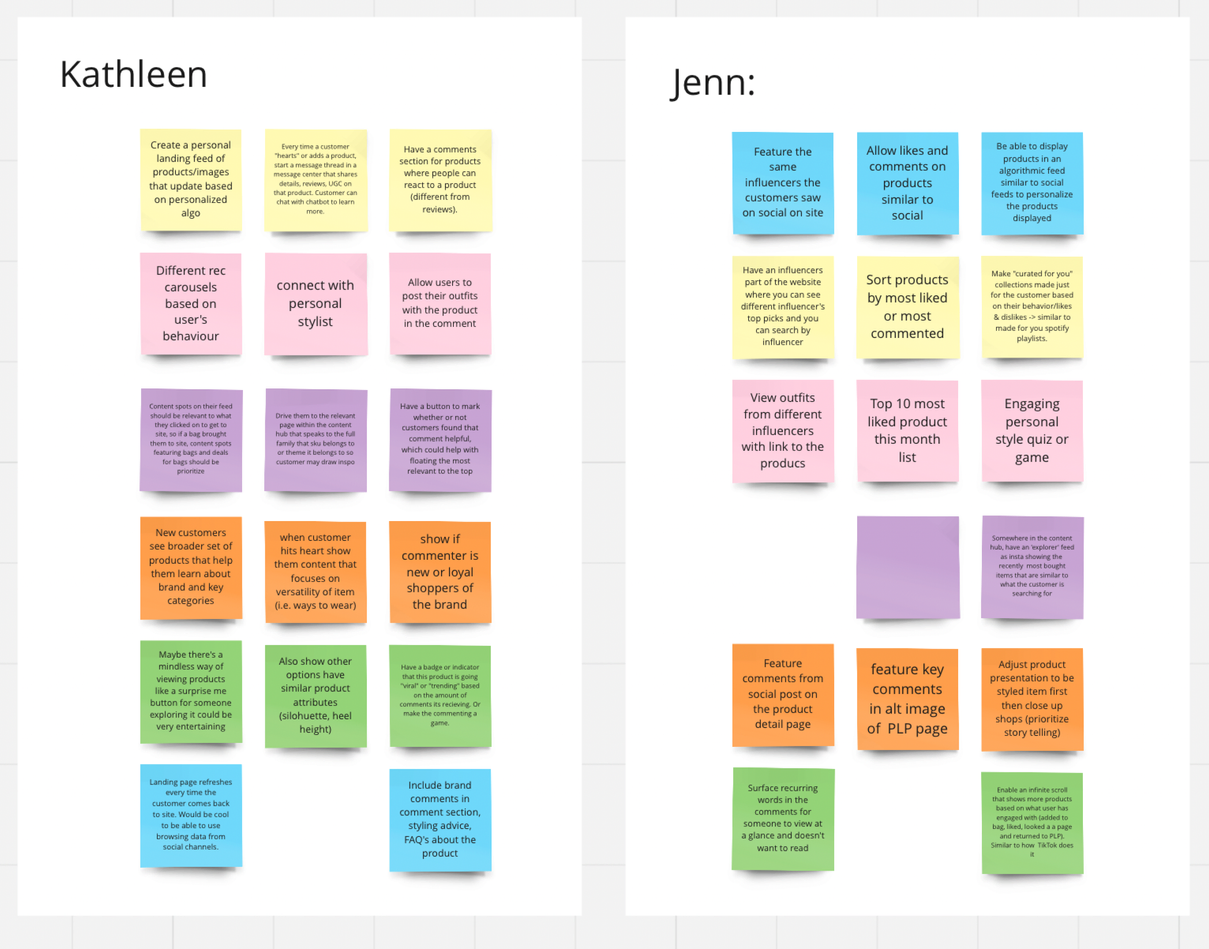
I like facilitating design thinking workshops and was new to fashion e-commerce, so I led a stakeholder brainstorm. It showed me the brand and UX team members’ perspectives before I proposed anything, and helped me avoid ideas that had already been tested. In Miro, the group completed a 6-3-5 brainstorm and produced over 100 ideas in an hour. I added more ideas inspired by their responses.
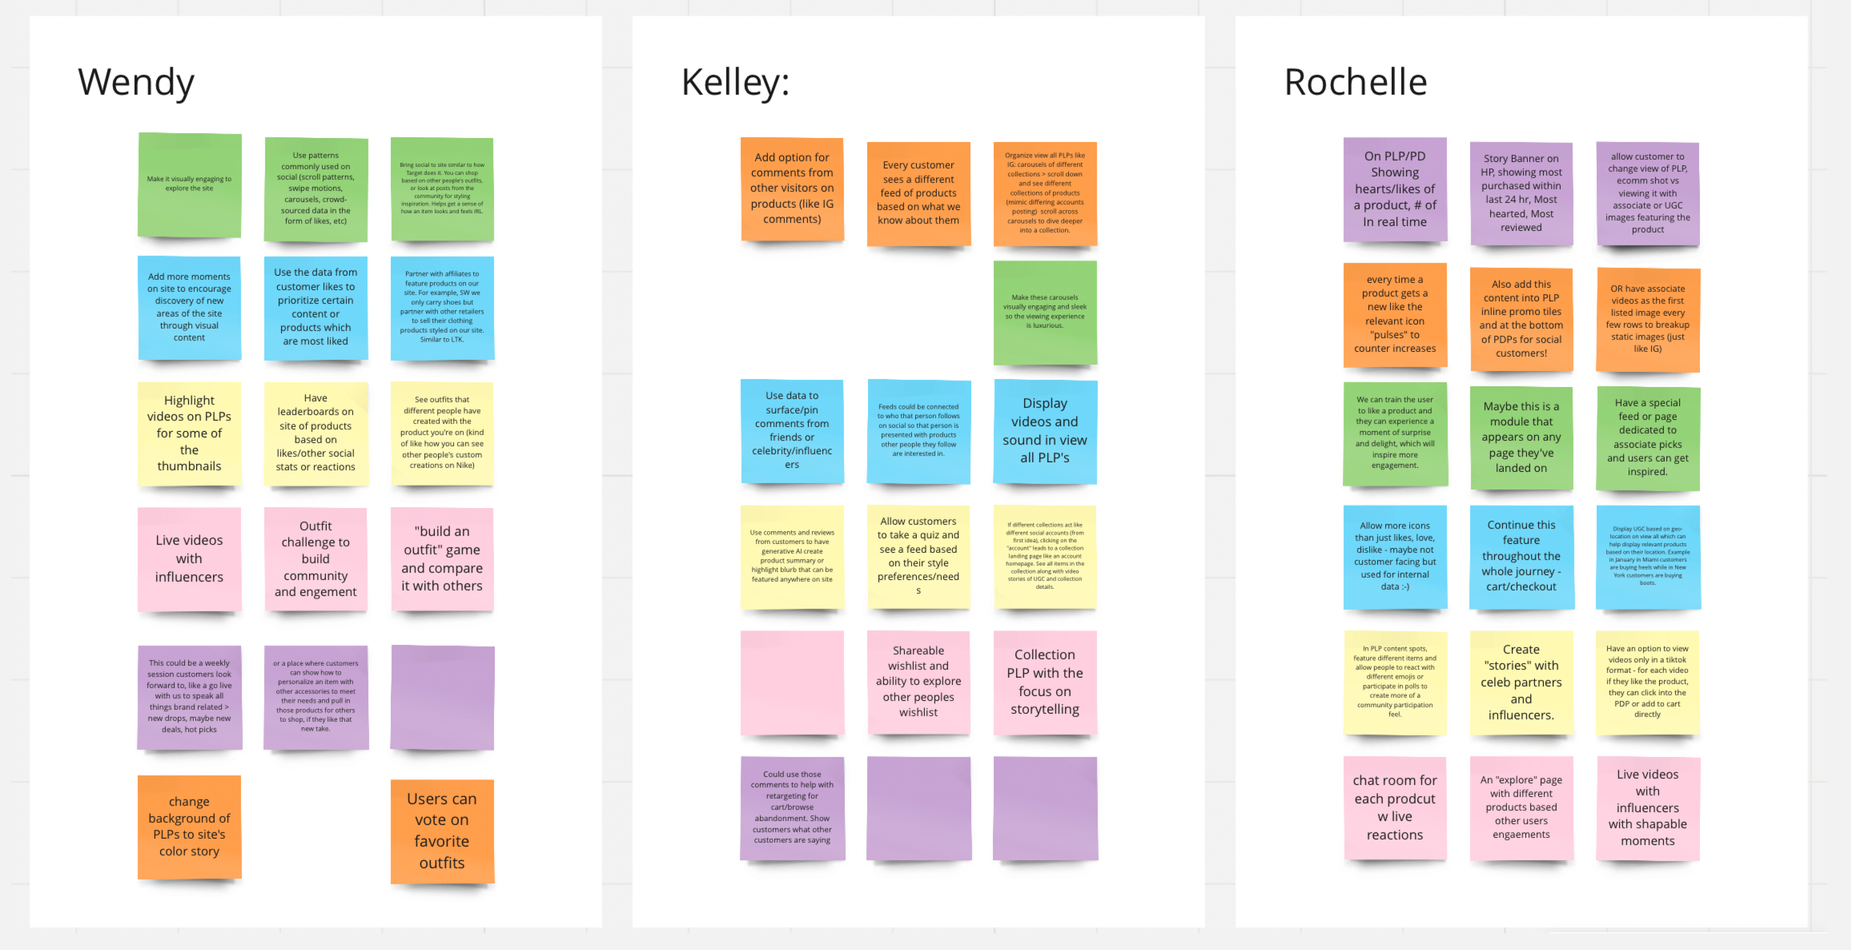
Prioritizing with a matrix
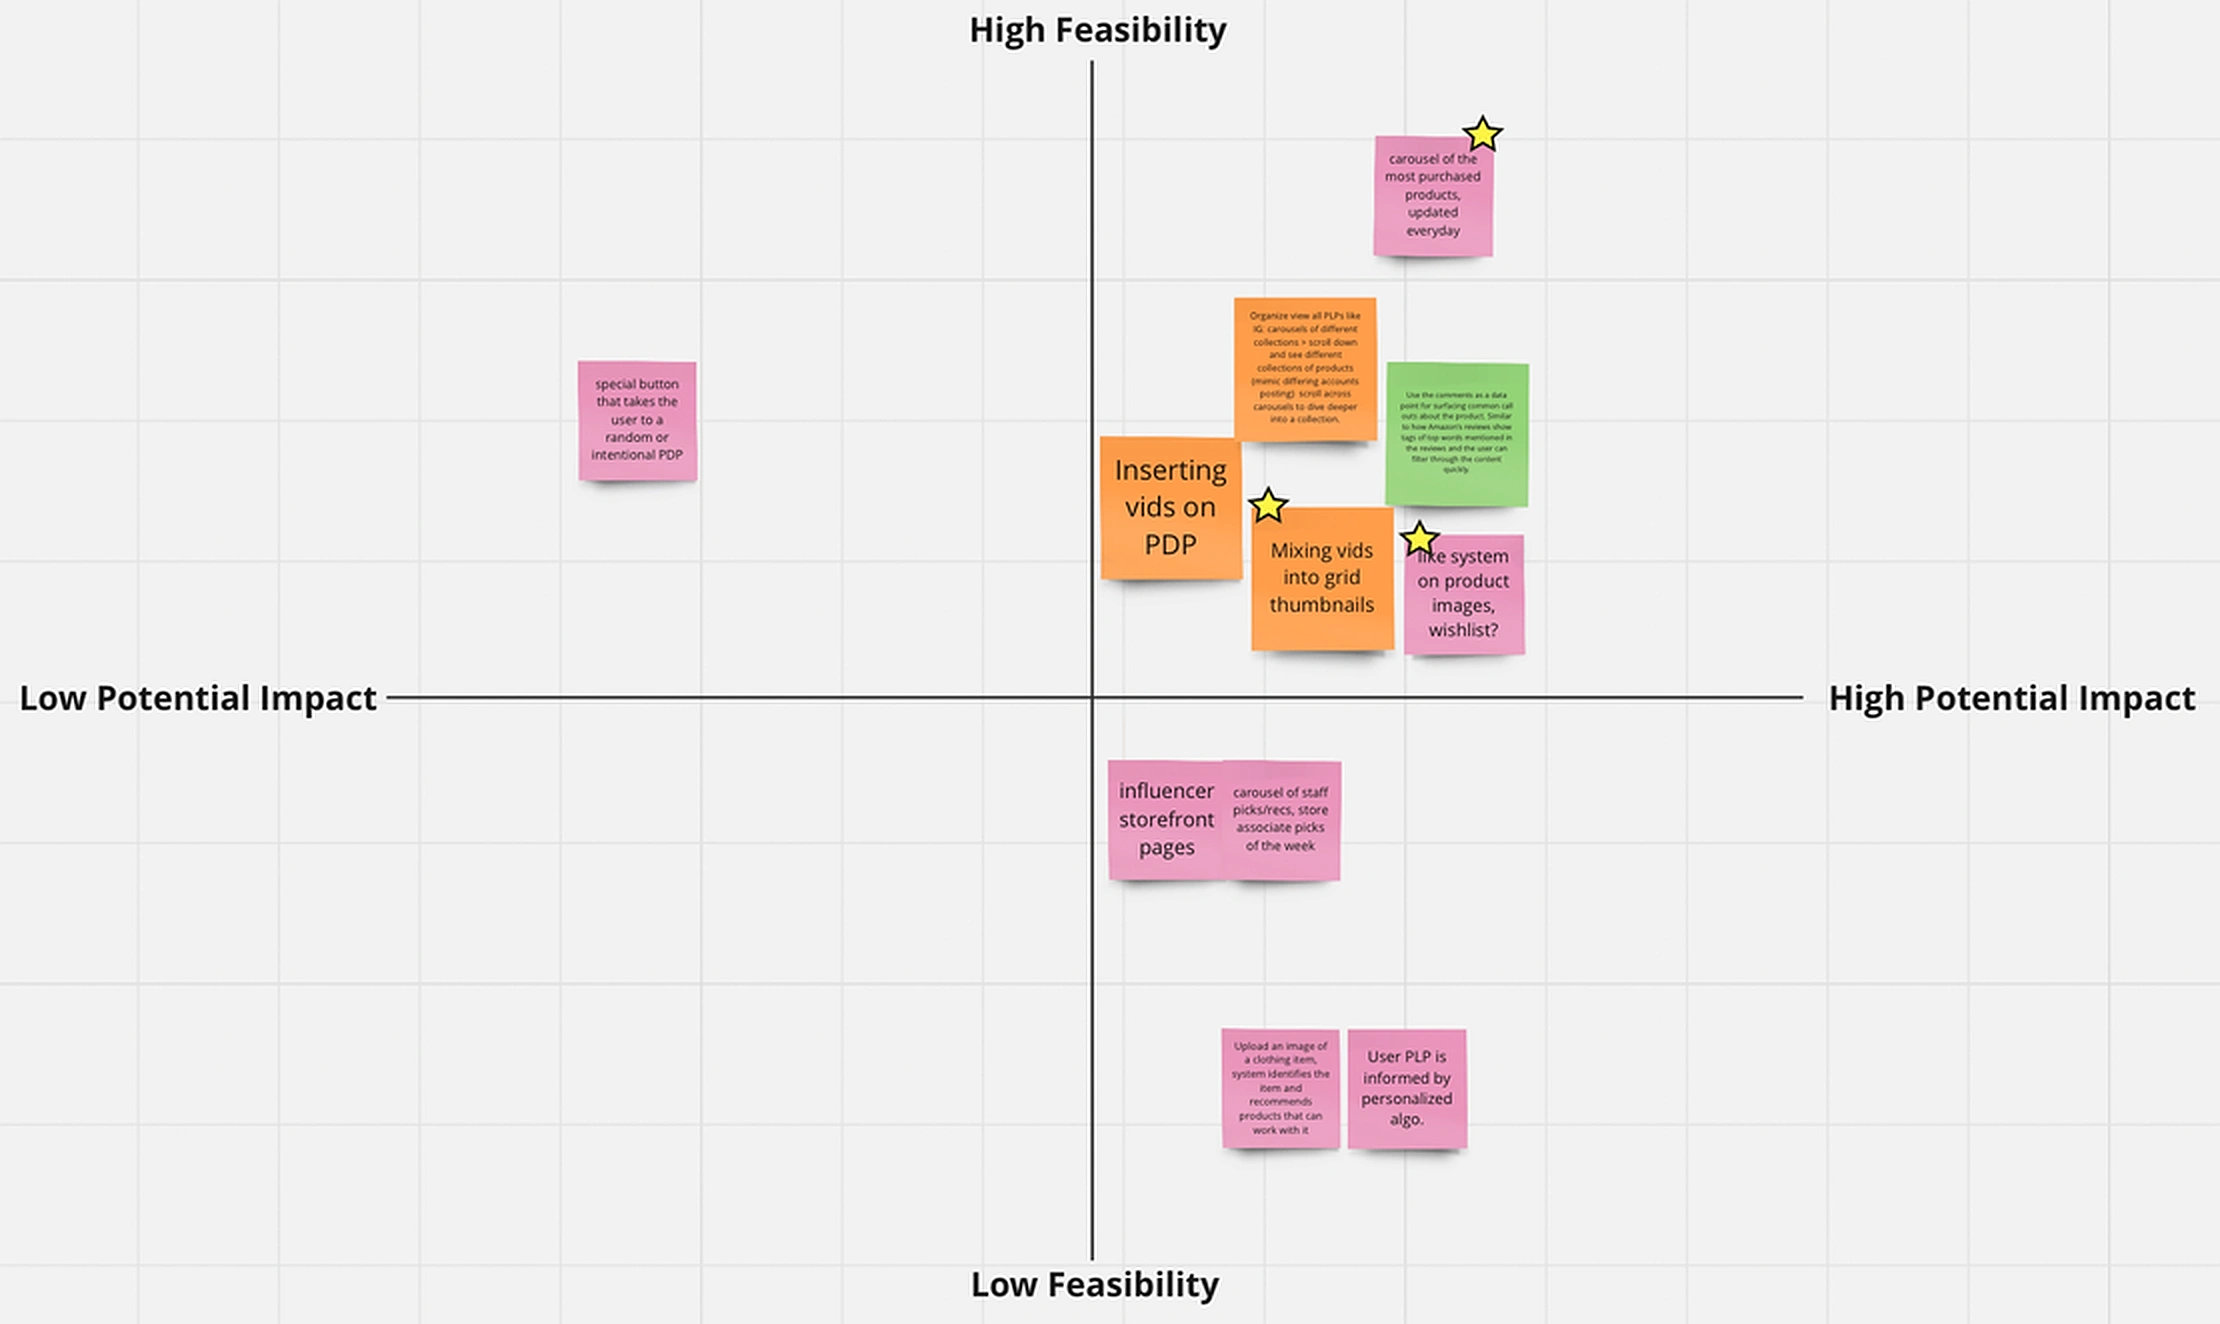
I grouped the ideas by commonality and placed the top ones on an impact and feasibility matrix, keeping the ten-week internship in mind. I picked five ideas to turn into test plans. After reviewing them with brand stakeholders and the testing team’s documentation, three of the five turned out to be untested.
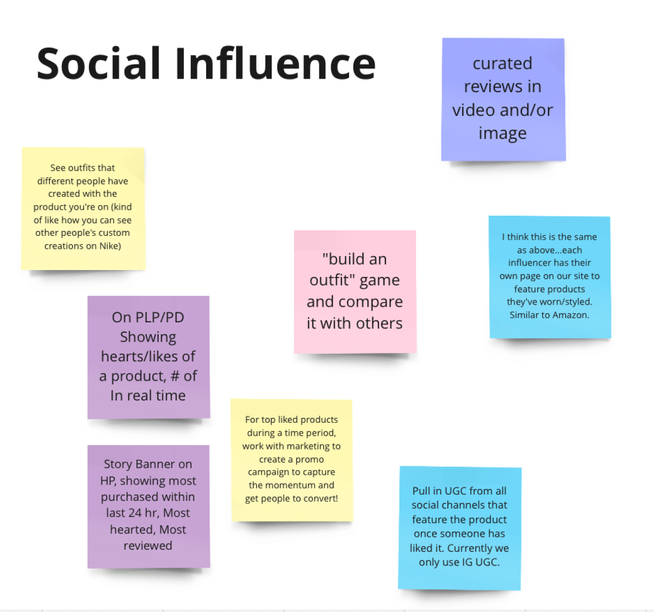
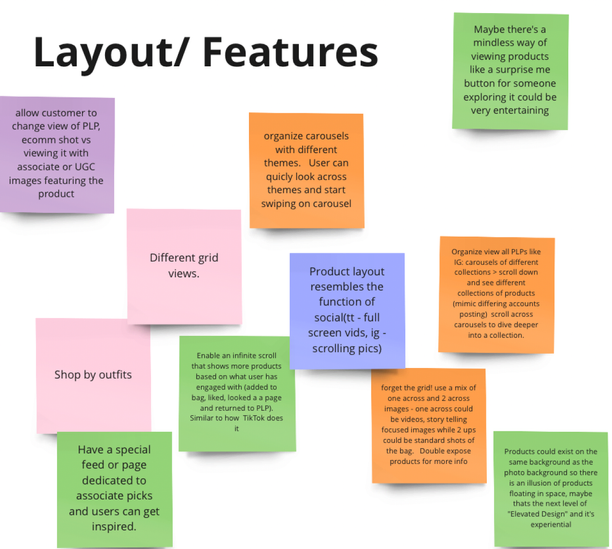
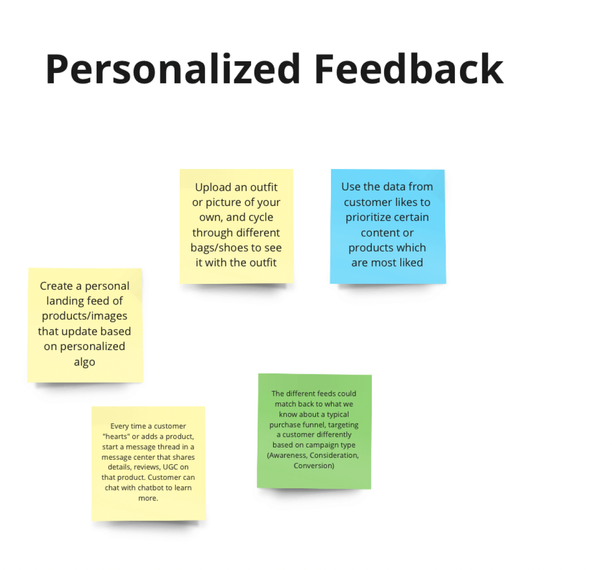
Choosing the like button
I proposed reinventing the like button, a feature familiar from across the internet. On every Tapestry brand site, tapping it adds the product to the wishlist. The Coach Outlet and Kate Spade Surprise teams both agreed to run the test on their sites.
Designing the variations with UX
Working closely with the UX team, we fleshed out the experience for the test. That led to a second variation with a tooltip that draws attention to the like button. Because of my design background, I also helped prepare the UX documentation.
Working with engineering
We could not show live like counts because of limited resources. After discussing alternatives with the testing team, we showed dummy numbers informed by existing data, using a calculation on the backend. The Tapestry legal team reviewed and approved this approach.
Outcomes
Impact
The test plan was added to the product roadmap and was projected to add over 1.2 million in revenue if successful. After running in Fall/Winter 2023, the control (the current website) beat the variations. The testing and brand teams still saw the importance of testing the like button further, so they are seeking help from vendors.
Key takeaways
Data can inform design
This was my first analytical role, collaborating with designers instead of owning the designs. Google Analytics showed patterns in user behavior that qualitative studies can miss, and they inspired design ideas. I hope to keep working with data.
Collaboration is ongoing
To formulate the test plan I had to balance each stakeholder’s recommendations and opinions. That built my soft skills in presenting, planning and leading meetings.